Learning Outcomes
- Graph a linear function using a table of values
- Graph a linear function using slope and [latex]y[/latex]-intercept
- Graph vertical and horizontal lines
- Identify parallel and perpendicular lines from a graph
Graphing Linear Functions Using Tables
One way to graph any function is to create a table of values. This is particularly useful when we do not know the general shape of the graphed function. We have already seen that the graph of a linear function is a line, but let’s make a table to see how it can be helpful.
To build a table of values we make a table consisting of two columns; one for [latex]x[/latex] and the other for [latex]y=f(x)[/latex]:
| [latex]x[/latex] | [latex]f(x)[/latex] |
|---|---|
We then choose several values for [latex]x[/latex] and enter them in separate rows in the [latex]x[/latex] column. The values we choose are totally up to us – there is no “right” or “wrong” values to pick, just go for it. It is a good idea to include negative values, positive values, and zero and ensure that we have enough points to determine the shape of the graph.
Suppose we’d like to graph the function [latex]f(x)=3x+2[/latex]. We start by adding our chosen [latex]x[/latex]-values to the table:
| [latex]x[/latex] | [latex]f(x)=3x+2[/latex] |
|---|---|
| [latex]−2[/latex] | |
| [latex]−1[/latex] | |
| [latex]0[/latex] | |
| [latex]1[/latex] | |
| [latex]3[/latex] |
We then evaluate the function for each chosen value of [latex]x[/latex], and write the result in the [latex]f(x)[/latex] column in the same row as the [latex]x[/latex] value we used.
To evaluate the function values, we replace [latex]x[/latex] in the function with one of our chosen values:
| [latex]x[/latex] |
[latex]f(x)=3x+2[/latex] |
|---|---|
| [latex]−2[/latex] | [latex]f(-2)=3(-2)+2=−4[/latex] |
| [latex]−1[/latex] | [latex]f(-1)=3(-1)+2=−1[/latex] |
| [latex]0[/latex] | [latex]f(0)=3(0)+2=2[/latex] |
| [latex]1[/latex] | [latex]f(1)=3(1)+2=5[/latex] |
| [latex]3[/latex] | [latex]f(3)=3(3)+2=11[/latex] |
Note that your table of values may be different from someone else’s as you may each choose different values for [latex]x[/latex].
Now that we have a table of values, we can use it to help us draw both the shape and location of the function by plotting [latex](x, f(x))[/latex] as coordinate points [latex](x, y)[/latex]. Each point we plot is a point on the graph. But there are an infinite number of points that make up the graph, so when we are sure the graph is a line, we join the dots using a straightedge to represent the entire graph.
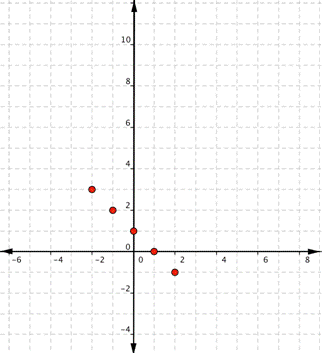
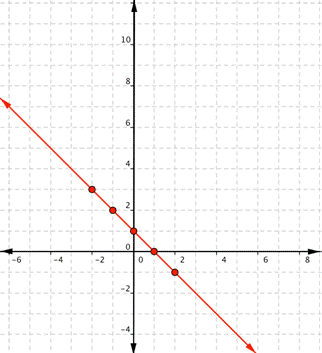
Example 1
Graph [latex]f(x)=−x+1[/latex].
Start with a table of values. Choose any values for [latex]x[/latex] that make sense to you, but remember that it is helpful to include [latex]0[/latex], some positive values, and some negative values.
| [latex]x[/latex] |
[latex]f(x)=-x+1[/latex] |
|---|---|
| [latex]−2[/latex] | [latex]f(-2)=-(-2)+1=3[/latex] |
| [latex]−1[/latex] | [latex]f(-1)=-(-1)+1=2[/latex] |
| [latex]0[/latex] | [latex]f(0)=-(0)+1=1[/latex] |
| [latex]1[/latex] | [latex]f(1)=-(1)+1=0[/latex] |
| [latex]2[/latex] | [latex]f(2)=-(2)+1=−1[/latex] |
Plot the points: Use a straightedge to draw the line:
The following video shows an example of how to graph a linear function on a coordinate plane.
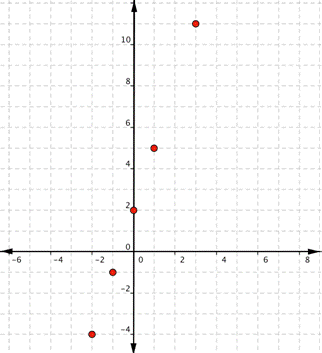
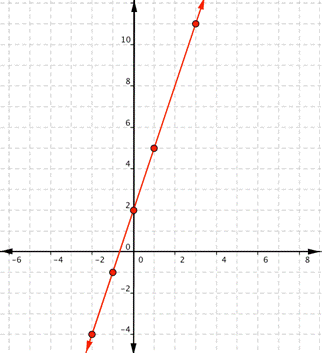
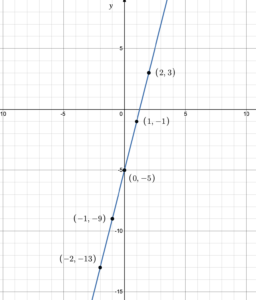
Example 2
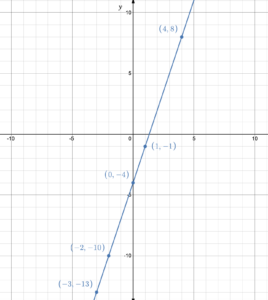
Build a table of values then graph the function [latex]g(x)=3x-4[/latex].
Solution
Choose any [latex]x[/latex]-values that include positives, negatives and 0, then determine the corresponding function values.
| [latex]x[/latex] | [latex]g(x)=3x-4[/latex] |
|---|---|
| -3 | [latex]g(-3)=3(-3)-4=-13[/latex] |
| -2 | [latex]g(-2)=3(-2)-4=-10[/latex] |
| 0 | [latex]g(0)=3(0)=-4[/latex] |
| 1 | [latex]g(1)=3(1)-4=-1[/latex] |
| 4 | [latex]g(4)=3(4)-4=8[/latex] |
Now plot the points and join the dots:
Try It 1
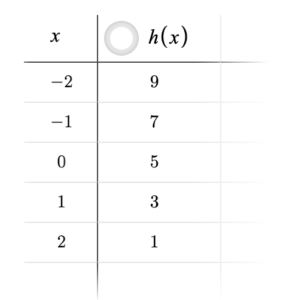
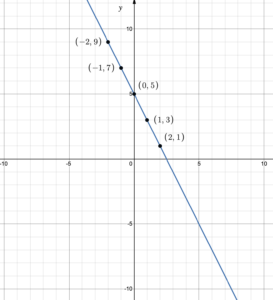
Build a table of values then graph the function [latex]h(x)=-2x+5[/latex].
Try It 2
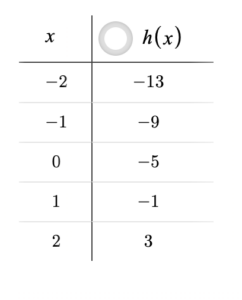
Build a table of values then graph the function [latex]h(x)=4x-5[/latex].
Graphing Linear Functions Using Slope and y-Intercept
Another way to graph a linear function is by using its slope and [latex]y[/latex]-intercept. The slope and [latex]y[/latex]-intercept of a linear function define a unique function, consequently there is only one possible graph that represents the function. The [latex]y[/latex]-intercept gives us a starting point on the coordinate plane, while the slope determines the direction we go in to determine another point on the line. Once we have two points on the line, we have a unique line. However, it is always better to determine three or more points.
As an example, consider the function [latex]f\left(x\right)=\dfrac{1}{2}x+1[/latex].
The function is in slope-intercept form, [latex]f(x)=mx+b[/latex]. so the slope is [latex]\dfrac{1}{2}[/latex] and the [latex]y[/latex]-intercept is the point (0, 1). Because the slope is positive, we know the graph will slant upward from left to right. The [latex]y[/latex]–intercept is the point on the graph where the graph crosses the [latex]y[/latex]-axis. We can begin graphing by plotting the point [latex](0, 1)[/latex]. We know that the slope [latex]m=\dfrac{\text{rise}}{\text{run}}[/latex], so the slope [latex]m=\dfrac{1}{2}[/latex] means that the rise is [latex]1[/latex] and the run is [latex]2[/latex]. Starting from our [latex]y[/latex]-intercept [latex](0, 1)[/latex], we can move vertically using the rise [latex]1[/latex] and then move horizontally using the run [latex]2[/latex], or first move horizontally using the run [latex]2[/latex] and then move vertically using the rise [latex]1[/latex] to get to the point (2, 2). We then repeat this process until we have a few points. Figure 1 shows this process and the result that all found points lie on a line. To form the complete line with an infinite number of coordinate points, we draw a line through the points (figure 1).
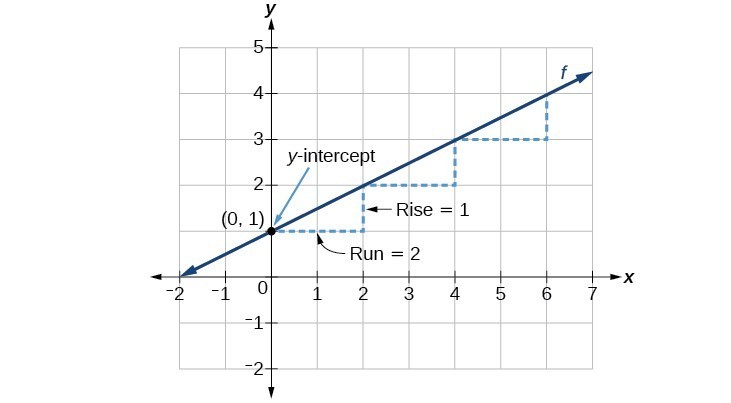
Figure 1. Graph of [latex]f\left(x\right)=\dfrac{1}{2}x+1[/latex]
Graphical Interpretation of a Linear Function
The function [latex]f\left(x\right)=mx+b[/latex] is interpreted graphically as a line where,
- [latex]b[/latex] is the [latex]y[/latex]-coordinate of the [latex]y[/latex]-intercept of the graph and indicates the point [latex](0,b)[/latex] at which the graph crosses the [latex]y[/latex]-axis.
- [latex]m[/latex] is the slope of the line and indicates the vertical displacement (rise) and horizontal displacement (run) between each successive pair of points.
All linear functions cross the [latex]y[/latex]-axis and therefore have [latex]y[/latex]-intercepts. The slope then locks in the direction and steepness of the line. This means that if we know the slope and [latex]y[/latex]-intercept, we know the unique graphical representation of the function.
Note: At this point you may be thinking that a vertical line parallel to the [latex]y[/latex]-axis does not have a [latex]y[/latex]-intercept. However, a vertical line is not a function as it represents a one-to-many mapping.
graphING A linear function using the y-intercept and slope
- Evaluate the function at [latex]x=0[/latex] to find the [latex]y[/latex]–intercept.
- Identify the slope.
- Plot the point represented by the [latex]y[/latex]–intercept.
- Identify the rise and the run from the slope and use these to determine at least one more point on the line.
- Draw the unique line that passes through all of the points.
Example 3
Graph [latex]f\left(x\right)=-\dfrac{2}{3}x+5[/latex] using the [latex]y[/latex]–intercept and slope.
Solution
Evaluate the function at [latex]x=0[/latex] to find the [latex]y[/latex]–intercept. [latex]f(0)=-\dfrac{2}{3}(0)+5=5[/latex], so the graph will cross the [latex]y[/latex]-axis at [latex](0, 5)[/latex].
According to the equation for the function, the slope of the line is [latex]-\dfrac{2}{3}[/latex]. This tells us that the “rise” of [latex]–2[/latex] units accompanies the “run” of [latex]3[/latex] units. We can now graph the function by first plotting the [latex]y[/latex]-intercept. Then, from the initial value [latex](0, 5)[/latex], we move down [latex]2[/latex] units and to the right [latex]3[/latex] units. We can extend the line to the left and right by using this relationship to plot additional points and then drawing a line through the points.
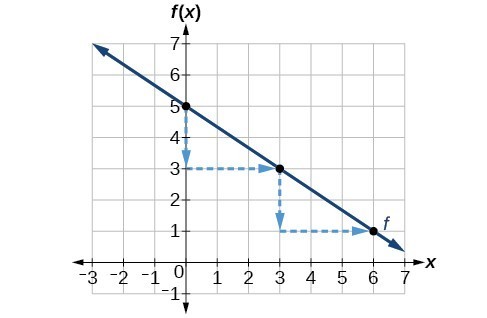
The graph slants downward from left to right, which means it has a negative slope as expected.
This should remind you of a staircase. As long as the rise and run of the staircase are constant from step to step, the stairs form a line from one floor to the next.
Try It 3
Note: The graph in OHM will accept only 2 points to draw a line.
The following video shows an example of how to graph a linear function given the [latex]y-[/latex]intercept and the slope.
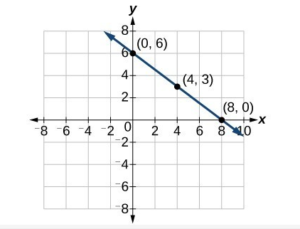
Example 4
Graph [latex]f\left(x\right)=-\dfrac{3}{4}x+6[/latex] using the slope and [latex]y[/latex]-intercept.
Solution
The function is of the form [latex]f(x)=mx+b[/latex], so the slope of this function is [latex]-\dfrac{3}{4}[/latex] and the [latex]y[/latex]-intercept is [latex](0,6)[/latex]. We can start graphing by plotting the [latex]y[/latex]-intercept and counting down three units (rise = -3) and right [latex]4[/latex] units (run = 4). The first stop is the point [latex](4,3)[/latex], and the next stop is the point [latex](8,0)[/latex]. Then join the dots to form the line.
Try It 4
Identify the slope and the [latex]y[/latex]-intercept, then graph the function [latex]d\left(x\right)=\dfrac{2}{3}x+3[/latex] using the slope and [latex]y[/latex]-intercept.

Vertical and Horizontal Lines
We saw in the last section that a horizontal line has a slope of zero and therefore the function [latex]f(x)=b[/latex] represents a horizontal line that passes through the [latex]y[/latex]-intercept [latex](0,b)[/latex].
For example, suppose we want to graph the function [latex]f(x)=-2[/latex]. No matter what [latex]x[/latex]-value we choose, the function value will always equal –2. Therefore, the points [latex]\left(-2,-2\right),\left(0,-2\right),\left(3,-2\right)[/latex], and [latex]\left(5,-2\right)[/latex] all lie on the graph. If we plot these points we see that they form a horizontal line:

Figure 2. Graph of function [latex]f(x)=-2[/latex].
We also saw in the last section that a vertical line does NOT represent a function, but it is a relation. In order for a line to be vertical, all of the [latex]x[/latex]-values must be the same. Therefore, the equation of a vertical line is given as [latex]x=c[/latex] where [latex]c[/latex] is a constant. The slope of a vertical line is undefined (since the run is zero, and we can’t divide by 0), and regardless of the [latex]y[/latex]–value of any point on the line, the [latex]x[/latex]–coordinate of the point will always be c.
For example, suppose we want to graph the equation [latex]x=-3[/latex]. The graph will contain the following points: [latex]\left(-3,-5\right),\left(-3,1\right),\left(-3,3\right)[/latex], and [latex]\left(-3,5\right)[/latex]. If we plot these points, we see they form a vertical line:

Figure 3. Graph of equation [latex]x=-3[/latex].
VERTICAL AND HORIZONTAL LINES
A linear function whose graph has a slope of zero forms a horizontal line. The function is of the form [latex]f(x)=b[/latex] where [latex]b[/latex] is a real number and is represented graphically by the [latex]y[/latex]-intercept [latex](0, b)[/latex].
A vertical line represents the equation [latex]x=c[/latex] where [latex]c[/latex] is a real number. This equation is NOT a function.
Example 5
Graph:
- [latex]f(x)=4[/latex]
- [latex]x=-1[/latex]
Solution
- The function [latex]f(x)=4[/latex] is represented by a horizontal line that passes through (0, 4).
- The equation [latex]x=-1[/latex] is represented by a vertical line that passes through (–1, 0).
Both graphs are shown:

Try It 5
Graph:
- [latex]f(x)=-6[/latex]
- [latex]x=4[/latex]

Parallel and Perpendicular Lines
Parallel lines have the same slope but different y-intercepts. Lines that are parallel to each other will never intersect. For example, figure 4 shows the graphs of three lines with the same slope, [latex]m=2[/latex]. Notice that each line goes in exactly the same direction because they have the same slope. Notice also that each line has a different [latex]y[/latex]-intercept. If these lines all had the same slope and the same [latex]y[/latex]-intercept, they would all lie on top of each other and be the same line. Such lines are referred to as coincidental lines, and we will see the significance of such lines later in this course.
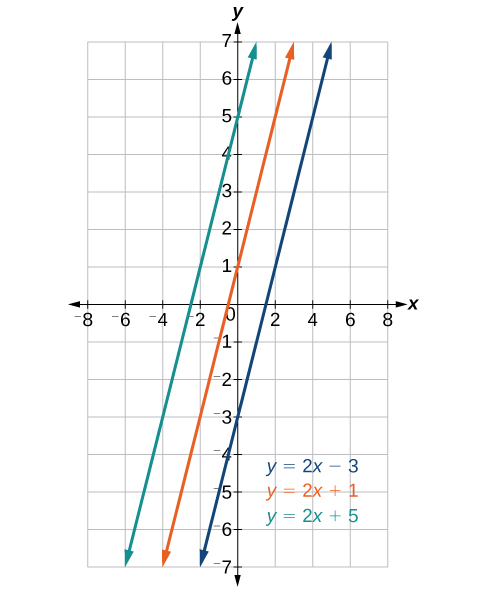 Figure 4. Parallel lines.
Parallel Lines
Two or more lines are parallel to each other if they have identical slopes but different [latex]y[/latex]-intercepts.
If one line has a slope of [latex]m_1[/latex] and a [latex]y[/latex]-intercept at [latex](0, b_1)[/latex] and another line has a slope of [latex]m_2[/latex] and a [latex]y[/latex]-intercept at [latex](0, b_2)[/latex], the lines are parallel if [latex]m_1=m_2[/latex] and [latex]b_1\ne b_2[/latex].
Example 6
Determine if the graph represents two parallel lines:

Solution
The blue line passes through the points (–6, 0) and (0, 4). [latex]m_1=\dfrac{\Delta y}{\Delta x}=\dfrac{4-0}{0-(-6)}=\dfrac{4}{6}=\dfrac{2}{3}[/latex].
The green line passes through the points (0, –3) and (6, 1). [latex]m_1=\dfrac{\Delta y}{\Delta x}=\dfrac{1-(-3)}{6-0)}=\dfrac{4}{6}=\dfrac{2}{3}[/latex].
Since the slopes are equal, the lines are parallel.
Try It 6
Determine if the graph represents two parallel lines:

Lines that are perpendicular intersect to form a [latex]{90}^{\circ }[/latex] angle (a right angle). The product of the slopes of perpendicular lines always equals –1.
If one line has a slope of [latex]m_1[/latex] and another line has a slope of [latex]m_2[/latex], the lines are perpendicular if [latex]m_1 \cdot m_2=-1[/latex]. This means that [latex]m_1=-\frac{1}{m_2}[/latex] and [latex]m_2=-\frac{1}{m_1}[/latex], i.e. the slopes are the negative reciprocal of each other.
For example, in figure 5 the orange line has a slope of [latex]m_1=3[/latex] and the blue line has a slope of [latex]m_2=-\frac{1}{3}[/latex]. The product of these two slopes is [latex]3\cdot \left ( -\frac{1}{3}\right )=-1[/latex]. Notice that [latex]3=\frac{3}{1}[/latex] and [latex]-\frac{1}{3}[/latex] are negative reciprocals of one another. i.e. if we turn one slope upside down and take it’s opposite, we get the other slope.
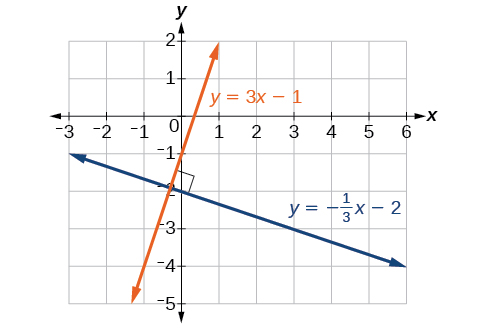 Figure 5. Perpendicular lines
Perpendicular Lines
Two lines are perpendicular to each other if the product of their slopes equals –1.
If one line has a slope of [latex]m_1[/latex] and another line has a slope of [latex]m_2[/latex], the lines are perpendicular if [latex]m_1 \cdot m_2=-1[/latex].
This means that [latex]m_1=-\frac{1}{m_2}[/latex] and [latex]m_2=-\frac{1}{m_1}[/latex], i.e. the slopes are the negative reciprocal of each other.
Example 7
Determine if the graph represents two perpendicular lines:

Solution
The blue line passes through the points (0, 6) and (4, –4).
This results in a slope of [latex]m_1=\dfrac{\Delta y}{\Delta x}=\dfrac{6-(-4)}{0-4}=\dfrac{10}{-4}=-\dfrac{5}{2}[/latex].
The green line passes through the points (0, –3) and (5, 0), resulting in a slope of [latex]m_1=\dfrac{\Delta y}{\Delta x}=\dfrac{0-(-3)}{5-0}=\dfrac{3}{5}[/latex].
[latex]m_1\cdot m_2=-\dfrac{5}{2}\cdot\dfrac{3}{5}=-\dfrac{3}{2}\ne -1[/latex]
Since the product of the slopes is not equal to –1, the lines are not perpendicular.
Try It 7
Determine if the graph represents two perpendicular lines:

Example 8
Graph the equations, and state whether the resulting lines are parallel, perpendicular, or neither: [latex]3y=-4x+3[/latex] and [latex]3x - 4y=8[/latex].
Solution
We can graph the lines using a table of values. To determine the corresponding [latex]y[/latex]-values we must substitute the chosen [latex]x[/latex]-value and solve the resulting equation in one variable.
Table of values for line 1:
| [latex]x=-3[/latex] | [latex]x=0[/latex] | [latex]x=3[/latex] | Resulting Table | ||||||||
|---|---|---|---|---|---|---|---|---|---|---|---|
| [latex]\begin{aligned}3y&=-4x+3\\ 3y&=-4(-3)+3\\3y&=12+3\\ 3y&=15\\y&=5\end{aligned}[/latex] | [latex]\begin{aligned}3y&= -4x+3\\ 3y& =-4(0)+3\\3y&=3\\ y&=1\end{aligned}[/latex] | [latex]\begin{aligned}3y& =-4x+3 \\3y&=-4(-)+3\\ 3y&=-12+3\\ 3y&=-9\\y&=-3\end{aligned}[/latex] |
|
Table of values for line 2:
| [latex]x=-4[/latex] | [latex]x=0[/latex] | [latex]x=4[/latex] | Resulting Table | ||||||||
|---|---|---|---|---|---|---|---|---|---|---|---|
| [latex]\begin{aligned}3x - 4y&=8\\3(-4)-4y&=8\\-12-4y&=8\\-4y&=20\\y&=-5\end{aligned}[/latex] | [latex]\begin{aligned}3x - 4y&=8\\3(0)-4y&=8\\-4y&=8\\y&=- 2\end{aligned}[/latex] | [latex]\begin{aligned}3x - 4y&=8\\3(4)-4y&=8\\12-4y&=8\\-4y&=-4\\y&=1\end{aligned}[/latex] |
|
 Now plot the points and graph each line:
From the graph, we can see that the lines appear perpendicular, but we must compare the slopes.
[latex]\begin{array}{l}{m}_{1}=-\frac{4}{3}\hfill \\ {m}_{2}=\frac{3}{4}\hfill \\ {m}_{1}\cdot {m}_{2}=\left(-\frac{4}{3}\right)\left(\frac{3}{4}\right)=-1\hfill \end{array}[/latex]
The slopes are negative reciprocals of each other, confirming that the lines are perpendicular.
Try It 8
Graph the equations, and state whether the resulting lines are parallel, perpendicular, or neither: [latex]2y-x=10[/latex] and [latex]2y=x+4[/latex].

Candela Citations
- Revision and Adaptation. Authored by: Hazel McKenna. Provided by: Lumen Learning. License: CC BY: Attribution
- All examples, Try Its . Authored by: Hazel McKenna. Provided by: Utah Valley University. License: CC BY: Attribution
- All graphs created using Desmos graphing calculator. Authored by: Hazel McKenna. Provided by: Utah Valley University. License: CC BY: Attribution
- Ex: Graph a Linear Function Using a Table of Values (Function Notation). Authored by: James Sousa (Mathispower4u.com) . Located at: https://youtu.be/sfzpdThXpA8. License: CC BY: Attribution
- Ex: Graph a Line and ID the Slope and Intercepts (Fraction Slope). Authored by: James Sousa (Mathispower4u.com) . Located at: https://youtu.be/N6lEPh11gk8. License: CC BY: Attribution
- QID 79774: Graph linear eq. in slope-intercept form, give slope and intercept.. Authored by: Day, Alyson. License: CC BY: Attribution
- Precalculus. Authored by: Jay Abramson, et al.. Provided by: OpenStax. Located at: http://cnx.org/contents/fd53eae1-fa23-47c7-bb1b-972349835c3c@5.175. License: CC BY: Attribution