Learning objectives
- Perform a vertical shift on a linear function
- Perform a vertical stretch or compression on a linear function
- Perform a reflection of a linear function across the [latex]x[/latex]-axis
- Perform a combination of transformations on a linear function
- Explain the transformations performed on [latex]f(x)=x[/latex] given the transformed function
- Write an algebraic function after completing transformations on the parent function
Recall the introduction to graphical transformations of a function we saw in section 1.3. A function may be transformed by a shift up, down, left, or right. A function may also be transformed using a reflection, stretch, or compression. The original function [latex]f(x)=x[/latex] is also known as the parent function and is the linear function used for transformations in this section. We will apply transformations graphically and consider what these transformations mean algebraically.
Vertical Shifts
Making a vertical shift means to move the graph of the linear function vertically up or down a certain number of units. When we shift a line up or down, the slope (steepness) of the line does not change. What changes is the [latex]y[/latex]-intercept. For example, the function [latex]f(x)=x[/latex] has a slope of 1 and a [latex]y[/latex]-intercept at (0, 0). If we shift the line up two units, the slope does not change, but the [latex]y[/latex]-intercept moves to (0, 2) (Figure 1).

Figure 1. Vertical shift
If fact, every point on the graph shifts up by 2 units so for every point on the line [latex]y=x[/latex], the [latex]y[/latex]-coordinate of each point increases by 2. This is shown in Table 1.
| [latex]x[/latex] | [latex]y[/latex] | [latex]y+2[/latex] |
|---|---|---|
| 0 | 0 | 2 |
| 1 | 1 | 3 |
| 2 | 2 | 4 |
| 3 | 3 | 5 |
| 4 | 4 | 6 |
| Table 1. Increase in [latex]y[/latex]-values | ||
In other words, the function [latex]f(x)=x[/latex] transforms to [latex]f(x)=x+2[/latex] because all of the [latex]y[/latex]-values are increased by 2.
If the function [latex]f(x)=x[/latex] is shifted down two units, it means all the [latex]y[/latex]-coordinates of the points on the line are decreased by 2 (increased by –2) (Table 2). In other words, the function [latex]f(x)=x[/latex] becomes [latex]f(x)=x-2[/latex] because all of the [latex]y[/latex]-values are decreased by 2. From another perspective, this transformation results in the original [latex]y[/latex]-intercept (0, 0) moving to (0, –2). Therefore, the function becomes [latex]f(x)=x-2[/latex].
| [latex]x[/latex] | [latex]y[/latex] | [latex]y–2[/latex] |
|---|---|---|
| 0 | 0 | 2 |
| 1 | 1 | 3 |
| 2 | 2 | 4 |
| 3 | 3 | 5 |
| 4 | 4 | 6 |
| Table 2. Decrease in [latex]y[/latex]-values | ||
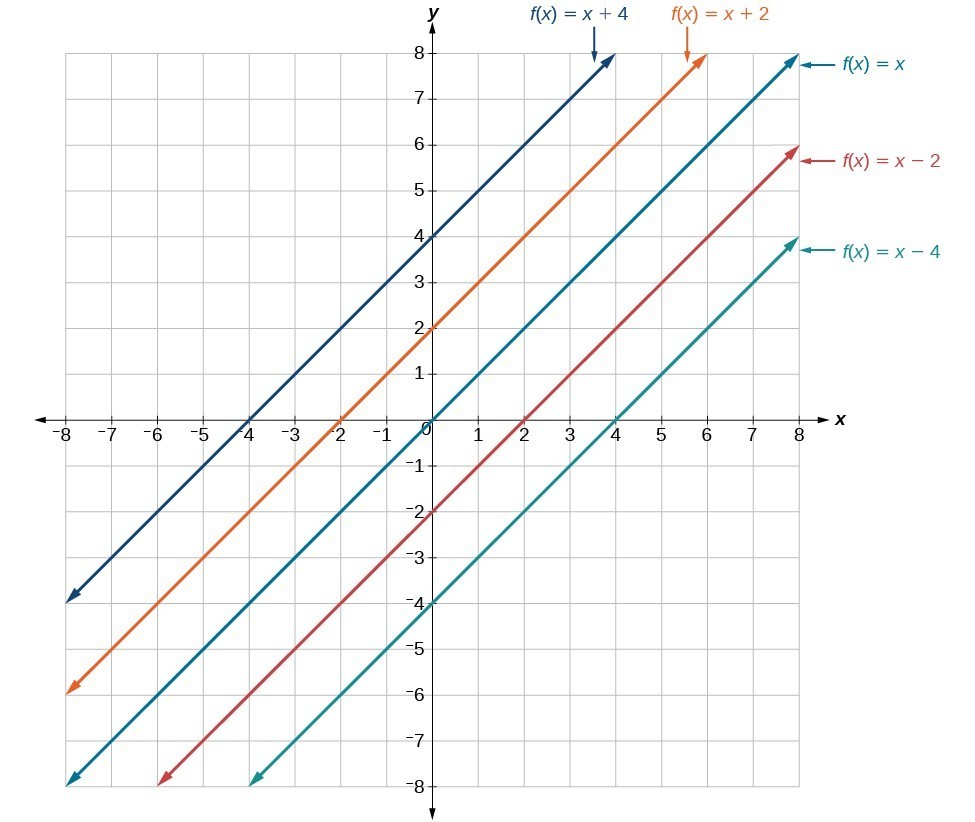
Figure 2. Vertical shifts.
This can be investigated in Desmos by changing the value of [latex]b[/latex]. Click on the desmos icon on the bottom right corner of figure 3 and move the slider to change the value of [latex]b[/latex].
Figure 3. Transformation of [latex]f(x)=x[/latex] to [latex]f(x)=x+b[/latex].
Example 1
The graph shows the function [latex]f(x)=x[/latex]. Use this graph to shift the function down by 4 units. Then write the equation of the new function.

Solution
When the function is shifted down by 4 units, it is the [latex]y[/latex]-coordinates that are decreased by 4 while the [latex]x[/latex]-coordinates stay the same.
The transformed function takes the form [latex]f(x)=x+b[/latex] where [latex]b=-4[/latex]: [latex]f(x)=x-4[/latex].
Try It 1
The graph shows the function [latex]f(x)=x[/latex]. Use this graph to shift the function up by 3 units . Then write the equation of the new function.
Vertical Stretching or Compressing
Vertically stretching
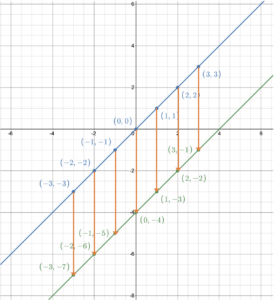
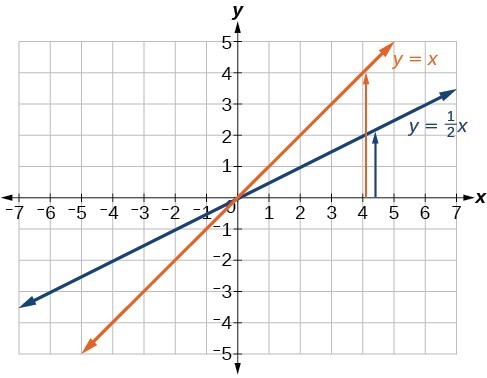
If we could grab both ends of the line and pull vertically in opposite directions (e.g., the end goes up if it is above the x-axis, and the end goes down if it is below the x-axis) we would stretch the line causing the slope of the line to increase. This is vertical stretching of a linear function. Another perspective of viewing vertically stretching a line is that every y coordinate of points on the line is multiplied by a number that is greater than 1. Therefore, if stretching a line vertically twice, the point (1, 2) becomes (1, 4) (e.g., the y-coordinate is twice larger) and the point (-2, -1) becomes (-2, -2).
To increase the steepness of a function the slope must increase from 1 to a number that is greater than 1. For example, stretching the function [latex]f(x)=x[/latex] to be twice as steep means multiplying the original slope of 1 by 2. Therefore, the stretched function becomes [latex]f(x)=2x[/latex]. It is important to note that the position of the [latex]y[/latex]-intercept does not change because there is no vertical shift.
Vertically compressing down
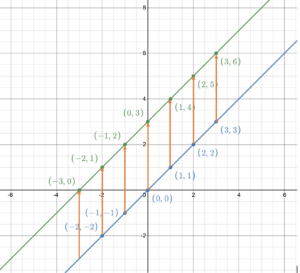
If instead of being able to stretch the ends of the line in opposite directions we were able to push the ends of the line, causing the slope of the line to decrease, we would witness vertical compression. The result would be to decrease the steepness (slope) of the line. Another perspective of viewing vertically compressing a line is that every y-coordinate of points on the line is multiplied by a number that is less than 1. Therefore, if compressing a line vertically to half of its height, the point (1, 2) becomes (1, 1) (e.g., the y-coordinate is half of its height) and the point (-2, -1) becomes (-2, -1/2).
To decrease the steepness of a line means to multiply the original slope of 1 by a number that is between 0 and 1. For example, compressing the function [latex]f(x)=x[/latex] to one-half of its height means multiplying the slope by [latex]\dfrac{1}{2}[/latex]. Therefore, the compressed function is [latex]f(x)=\dfrac{1}{2}x[/latex]. It is important to note that the position of the [latex]y[/latex]-intercept does not change because there is no vertical shift.
Figure 4 illustrates the graphs of various functions that are the result of stretching ([latex]m>1[/latex] or compressing ([latex]0≤m<1[/latex] the function [latex]f(x)=x[/latex] to [latex]f(x)=mx[/latex].

Figure 4. Stretching and compressing a linear function.
This can be investigated in Desmos by changing the value of [latex]m[/latex]. Click on the desmos icon on the bottom right corner of figure 5 and move the slider to change the value of [latex]m[/latex]. Notice what happens to the coordinate (1, 1) on the original graph as the transformation plays out.
Figure 5. Transformation of [latex]f(x)=x[/latex] to [latex]f(x)=mx[/latex].
Example 2
Describe the transformation of the function [latex]f(x)=x[/latex] to the function [latex]f(x)=\dfrac{2}{3}x[/latex] and draw a graph.
Solution
The transformed function has a slope of [latex]m=\dfrac{2}{3}[/latex], so this is a vertical compression since [latex]0
Note how the original function is compressed because the rate of change is “slowed”.
Example 3
Write the equation of the transformation when [latex]f(x)=x[/latex] is stretched vertically by a factor of 3.
Solution
All the function values must be multiplied by 3, while the [latex]x[/latex]-values stay the same.
[latex]f(x)=3x[/latex]
try it 2
Write the equation of the transformation when [latex]f(x)=x[/latex] is stretched or compressed vertically by the given factor:
- Stretched by a factor of 7
- Compressed to one-third its height
- Compressed to one-fourth its height
- Stretched by a factor of 5
Reflection Across the x-axis
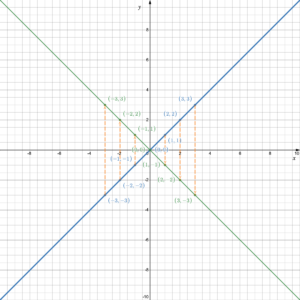
Reflecting a linear function across the x-axis means to flip the line representing the function across the x-axis. This results in a mirror image of the original function with respect to the x-axis. To reflect a linear function across the [latex]x[/latex]-axis means all points on the line will see their [latex]y[/latex]-coordinates change sign; positive [latex]x[/latex]-coordinates will become negative (e.g, (2, 2) becomes (2, -2)), and negative [latex]y[/latex]-coordinates will become positive (e.g., (1, –5) becomes (1, 5)). From an algebraic point of view, vertically flipping the graph of the function [latex]f(x)=x[/latex] is equivalent to multiplying the [latex]x[/latex]-values by –1. That is, the [latex]y[/latex] value in [latex]y=f(x)=x[/latex] becomes [latex]y=f(x)=-x[/latex] (e.g., positive [latex]y[/latex] values become negative, or negative [latex]y[/latex] values become positive). So [latex]f(x)=x[/latex] becomes [latex]f(x)=-x[/latex]. Table 3 shows the transformation.
| [latex]x[/latex] | [latex]f(x)=x[/latex] | [latex]f(x) = -x[/latex] |
|---|---|---|
| -3 | -3 | 3 |
| -2 | -2 | 2 |
| -1 | -1 | 1 |
| 0 | 0 | 0 |
| 1 | 1 | -1 |
| 2 | 2 | -2 |
| 3 | 3 | -3 |
| Table 3. | ||
Example 4
The graph shows the function [latex]f(x)=x[/latex]. Use this graph to reflect the function across the [latex]x[/latex]-axis. Then write the equation of the new function.
Solution
All of the [latex]y[/latex]-values change sign with the function values staying the same. So (3, 3) moves to (3, –3), (–1, –1) moves to (–1, 1) etc. Once the new points have been plotted the new line can be drawn.
The new function is [latex]f(x)=-x[/latex].
Combining Transformations
We can combine different transformations, one after the other. Suppose we want to transform the function [latex]f(x)=x[/latex] by reflecting this function across the [latex]x[/latex]-axis, shifting it up 3 units. The reflection across the [latex]x[/latex]-axis results in the new function [latex]f(x)=-x[/latex]. The vertical shift of 3 units up results in the function [latex]f(x)=-x+3[/latex].
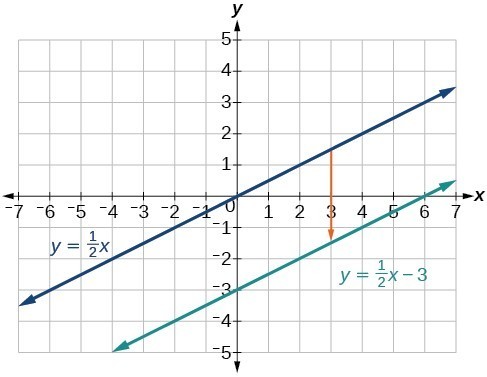
Example 5
Graph [latex]f\left(x\right)=\dfrac{1}{2}x - 3[/latex] using transformations of [latex]f(x)=x[/latex].
Solution
The equation for the function shows that [latex]m=\dfrac{1}{2}[/latex], so the original function is vertically compressed to one-half its height. The equation for the function also shows that [latex]b=–3[/latex], so the original function is vertically shifted down by 3 units. First, graph the function [latex]f(x)=x[/latex] and show the vertical compression (the [latex]y[/latex]-values are all divided by 2).
Now show the vertical shift. The function [latex]y=\dfrac{1}{2}x[/latex] is shifted down by 3 units.
The following video describes a linear transformation of the function [latex]f(x)=x[/latex] and its corresponding graph.
Try It 3
Use transformations of [latex]f(x)=x[/latex] to graph [latex]f(x)=-2x+5[/latex].
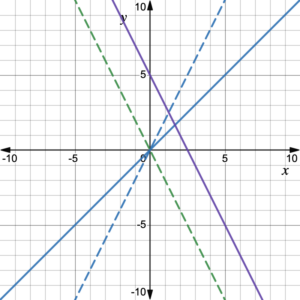
Combinations of transformations can be investigated using the Desmos graph in figure 8. Move the green “Change b” point up or down to change the value of [latex]b[/latex] and move the “Change m” point left or right to change the value of [latex]m[/latex].