Learning Outcomes
- Determine the role that the values [latex]a, b[/latex] and [latex]c[/latex] play in the graph of [latex]y=ax^2+bx+c[/latex]
Keywords
- Parent equation: the simplest form of a general equation
- Parabola: the shape of any quadratic equation
Graphing Quadratic Equations Using Transformations
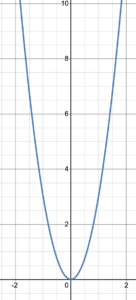
In the previous section we learned that the shape of [latex]y=x^2[/latex] is called a parabola. The turning point on the graph is called the vertex. The vertical line that passes through the vertex and splits the parabola into two mirror images is called the line of symmetry. All quadratic functions have graphs in the shape of a parabola. However, in the general equation [latex]y=ax^2+bx+c[/latex] the values of [latex]a[/latex], [latex]b[/latex], and [latex]c[/latex] change the direction, shape, and position of the graph. Let’s discover how changing these values can transform a graph.
How [latex]a[/latex] affects the graph of [latex]y=ax^{2}+bx+c[/latex]
Figure 1 shows an animation of the graph [latex]y=ax^2[/latex] as the value of [latex]a[/latex] moves between [latex]-10[/latex] and [latex]10[/latex]. Click on the desmos logo at the bottom right corner of the graph to manipulate the value of [latex]a[/latex].
Figure 1: Animation of [latex]y=ax^2[/latex] as [latex]a[/latex] changes.
The value of [latex]a[/latex] tells us whether the parabola opens upwards ([latex]a>0[/latex]) or downwards ([latex]a<0[/latex]). If [latex]a[/latex] is positive, the vertex is the turning point and the lowest point on the graph and the graph opens upward. If [latex]a[/latex] is negative, the vertex is the turning point and the highest point on the graph and the graph opens downward.
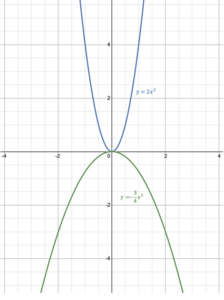
Figure 2. Graph of [latex]y=ax^2[/latex] with different values of [latex]a[/latex].
The value of [latex]a[/latex] also tells us about the width of the graph. When [latex]|a|>1[/latex], as in [latex]y=2x^2[/latex] in figure 2, the graph will appear more narrow than [latex]y=x^2[/latex]. When [latex]|a|<1[/latex], as in [latex]y=-\frac{3}{4} x^2[/latex] in figure 2, the graph will appear wider than [latex]y=x^2[/latex].
Example
Match each function with its graph.
- [latex]\displaystyle y=3{{x}^{2}}[/latex]
- [latex]\displaystyle y=-2{{x}^{2}}[/latex]
- [latex]\displaystyle y=-8{x}^{2}[/latex]
- [latex]\displaystyle y=7{x}^{2}[/latex]
Graph A
Graph B
Graph C
Graph D
Solution
1. [latex]\displaystyle y=3{{x}^{2}}[/latex] opens upwards and passes through the point [latex](1, 3)[/latex]: Graph D
2. [latex]\displaystyle y=-2{{x}^{2}}[/latex]nopens downwards and passes through the point [latex](1, -2)[/latex]: Graph B
3. [latex]\displaystyle y=-8{x}^{2}[/latex] opens downwards and passes through the point [latex](1, -8)[/latex]: Graph C
4. [latex]\displaystyle y=7{x}^{2}[/latex] opens upwards and passes through the point [latex](1, 7)[/latex]: Graph A
We can compare the graphs to the graph of the parent equation [latex]y=x^2[/latex]. If [latex]|a|>1[/latex], the graph of [latex]y=ax^2[/latex] will be thinner than that of [latex]y=x^2[/latex]. If [latex]0<|a|<1[/latex], the graph of [latex]y=ax^2[/latex] will be broader than that of [latex]y=x^2[/latex]. And remember that when [latex]a<0[/latex] the graph opens downwards.
Example
Given the graph of [latex]y=x^2[/latex] shown in black, determine the relative value of [latex]a[/latex] in the graph of [latex]y=ax^2[/latex] shown in blue.

Graph 1

Graph 2

Graph 3
Graph 1. The blue graph is narrower than the graph of [latex]y=x^2[/latex] and opens upwards, which means that [latex]a>1[/latex].
Graph 2. The blue graph opens downwards so has a negative value of [latex]a[/latex]. It is also broader that [latex]y=x^2[/latex] so [latex]|a|<0[/latex]. This means that [latex]-1
Try It
Determine whether each statement is true or false. Support your answer.
- The graph of [latex]y=4x^2[/latex] is narrower than the graph of [latex]y=x^2[/latex].
- The graph of [latex]y=-3x^2[/latex] is broader than the graph of [latex]y=x^2[/latex].
- The graph of [latex]y=-7x^2[/latex] opens in the same direction as [latex]y=x^2[/latex].
- The graph of [latex]y=-\frac{2}{3}x^2[/latex] opens in the same direction as [latex]y=-x^2[/latex] and is broader than [latex]y=x^2[/latex].
Think about It
We said that:
If [latex]|a|>1[/latex], the graph of [latex]y=ax^2[/latex] will be thinner than that of [latex]y=x^2[/latex]. If [latex]0<|a|<1[/latex], the graph of [latex]y=ax^2[/latex] will be broader than that of [latex]y=x^2[/latex]. And remember that when [latex]a<0[/latex] the graph opens downwards. What about if [latex]a=0[/latex]? What happens to the graph of [latex]y=ax^2[/latex] when [latex]a=0[/latex]?
How [latex]c[/latex] affects graphs of quadratic equations
When a quadratic equation is in the form [latex]y=ax^2+c[/latex], [latex]b=0[/latex] and there is no [latex]x[/latex]-term. Figure 3 shows an animation of the graph [latex]y=x^2+c[/latex] as the value of [latex]c[/latex] moves between [latex]-10[/latex] and [latex]10[/latex]. Click on the desmos logo at the bottom right corner of the graph to manipulate the value of [latex]c[/latex].
Figure 3: Animation of [latex]y=x^2+c[/latex] as [latex]c[/latex] changes.
Changing the value of [latex]c[/latex] moves the parabola up or down the [latex]y[/latex]-axis. If [latex]c>0[/latex], the graph of [latex]y=x^2[/latex] moves up the axis [latex]c[/latex] units. If [latex]c<0[/latex], the graph of [latex]y=x^2[/latex] moves down the axis [latex]c[/latex] units.
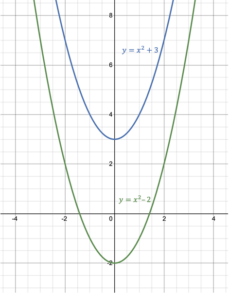
Figure 4. Graph of [latex]y=x^2+c[/latex] with different values of [latex]c[/latex].
Example
Explain how the graph of the given equation is different from the graph of [latex]y=x^2[/latex].
- [latex]\displaystyle y={{x}^{2}}+3[/latex]
- [latex]\displaystyle y={{x}^{2}}-4[/latex]
Solution
- The graph of [latex]\displaystyle y={{x}^{2}}+3[/latex] looks exactly like the graph of [latex]y=x^2[/latex] but it has been moved vertically up by [latex]3[/latex] units.
- The graph of [latex]\displaystyle y={{x}^{2}}-4[/latex] looks exactly like the graph of [latex]y=x^2[/latex] but it has been moved vertically down by [latex]4[/latex] units.
Try It
Explain how the graph of the given equation is different from the graph of [latex]y=x^2[/latex].
- [latex]y=x^2-7[/latex]
- [latex]y=x^2+1[/latex]
Try It
Determine the equation of each graph, using the graph of [latex]y=x^2[/latex] shown in black as the parent graph.
Graph 1
Graph 2
When we are graphing any quadratic equation, it is also useful to know that [latex]c[/latex] corresponds to the [latex]y[/latex]-intercept of the graph of any quadratic equation. The [latex]y[/latex]-intercept occurs when [latex]x=0[/latex] and is the point at which the graph crosses the [latex]y[/latex]-axis. Recall that we determine the value of [latex]y[/latex] by substituting [latex]x=0[/latex] into the equation:
[latex]y=a(0)^2+b(0)+c=c[/latex]
For a quadratic equation, the [latex]y[/latex]-intercept is always the point [latex](0,c)[/latex].
How [latex]b[/latex] affects graphs of quadratic equations
When a quadratic equation is in the form [latex]y=ax^2+bx[/latex], [latex]c=0[/latex] and therefore the [latex]y[/latex]-intercept will always be [latex](0, 0)[/latex]. Figure 5 shows an animation of the graph [latex]y=x^2+bx[/latex] as the value of [latex]b[/latex] moves between [latex]-10[/latex] and [latex]10[/latex]. Click on the desmos logo at the bottom right corner of the graph to manipulate the value of [latex]b[/latex].
Figure 5. Animation of [latex]y=x^2+bx[/latex] as [latex]b[/latex] changes.
Changing [latex]b[/latex] moves the vertex and the line of symmetry, which is the vertical line that passes through the vertex of the parabola. When [latex]b>0[/latex] the vertex moves to the left. When [latex]b<0[/latex] the vertex moves to the right. However, the vertex doesn’t just move horizontally, but vertically as well. Notice that the vertex moves following a parabolic curve! Moving the vertex also moves the line of symmetry, since the line of symmetry passes through the vertex. In addition, notice that the [latex]x[/latex]– and [latex]y[/latex]-intercepts stay the same at [latex](0, 0)[/latex], but the other [latex]x[/latex]-intercept moves between [latex]x=-10[/latex] when [latex]b=10[/latex] to [latex]x=10[/latex] when [latex]b=-10[/latex].
To help explain this movement, let’s find the [latex]x[/latex]-intercepts by setting [latex]y=0[/latex]:
[latex]\begin{equation}\begin{aligned} y&=x^2+bx \\ 0&=x^2+bx \;\;\quad\quad\quad\quad\text{Substitute }x=0 \\ 0&=x(x+b)\;\qquad\quad\quad\text{Factor out the GCF }x\\ x&=0\text{ or }x+b=0\quad\quad\text{Set each equation to zero}\\ x&=0\text{ or }x=-b\quad\quad\quad\text{Solve each equation}\end{aligned}\end{equation}[/latex]
So the [latex]x[/latex]-intercepts are [latex](0, 0)\text{ and }(0, -b)[/latex]. [latex](0, 0)[/latex] is a fixed point so does not move as the value of [latex]b[/latex] changes. However, [latex](0, -b)[/latex] changes as [latex]b[/latex] changes. For example, when [latex]b=2[/latex] the intercept changes to [latex](0, -2)[/latex] and when [latex]b=-5[/latex] the intercept changes to [latex](0, 5)[/latex]. Do you see the pattern?
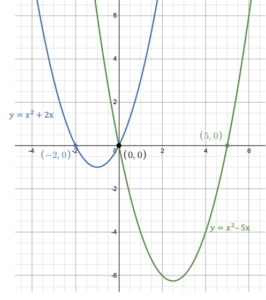
Figure 6. Graph of [latex]y=x^2+bx[/latex] with [latex]x[/latex]-intercepts at [latex](0, 0)[/latex] and [latex](-b, 0)[/latex].
Examples
State the [latex]x[/latex]-intercepts of the graph of the equation:
- [latex]y=x^2+3x[/latex]
- [latex]y=x^2-7x[/latex]
- [latex]y=x^2+\frac{3}{4}x[/latex]
Solution
The [latex]x[/latex]-intercepts of the graph of [latex]y=x^2+bx[/latex] are [latex](0, 0)[/latex] and [latex](–b,0)[/latex].
- Since [latex]b=3[/latex], the intercepts are [latex](0, 0)[/latex] and [latex](0, –3)[/latex].
- Since [latex]b=-7[/latex], the intercepts are [latex](0, 0)[/latex] and [latex](0, 7)[/latex].
- Since [latex]b=\frac{3}{4}[/latex], the intercepts are [latex](0, 0)[/latex] and [latex](0, –\frac{3}{4})[/latex].
Try It
State the [latex]x[/latex]-intercepts of the graph of the equation:
- [latex]y=x^2+9x[/latex]
- [latex]y=x^2-4x[/latex]
- [latex]y=x^2+\frac{4}{5}x[/latex]
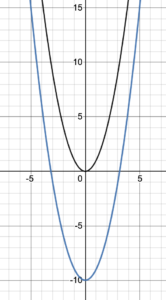
Because of symmetry, the vertex is always exactly halfway between the two [latex]x[/latex]-intercepts [latex](0, 0)[/latex] and [latex](0, –b)[/latex]. For example, in the graph [latex]y=x^2+4x[/latex] the [latex]x[/latex]-intercepts are [latex](0, 0)[/latex] and [latex](0, -4)[/latex] (figure 7). The axis of symmetry is the vertical line that passes through the vertex and lies exactly halfway between [latex]x=-4[/latex] and [latex]x=0[/latex]. i.e. the line of symmetry is [latex]x=-2[/latex].
Figure 7. [latex]y=x^2+4x[/latex]
This also means that the vertex has an [latex]x[/latex]-value of [latex]-2[/latex] since the line of symmetry passes through the vertex. The [latex]y[/latex]-coordinate of the vertex is found by substituting [latex]x=-2[/latex] into the equation [latex]y=x^2+4x[/latex]: [latex]y=(-2)^2+4(-2)=4-8=-4[/latex]. So the vertex is the point [latex](-2, -4)[/latex] as can be seen on the graph in figure 7.
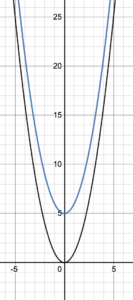
In the more general case of [latex]y=x^2+bx[/latex], the line of symmetry is exactly halfway between the two [latex]x[/latex]-intercepts [latex](0, 0)[/latex] and [latex](0, -b)[/latex]. i.e. the line of symmetry is [latex]x=\frac{-b}{2}[/latex]. Of course, this assumes that [latex]a=1[/latex] and [latex]c=0[/latex]. If [latex]a[/latex] and [latex]c[/latex] take on different values, determining the exact movement of the graph becomes a little more difficult.
The following animation shows what happens to the graph of [latex]y=ax^2+bx+c[/latex] when the values of [latex]a, b[/latex] and [latex]c[/latex] are changed. Click on the desmos logo at the bottom right corner of the graph to manipulate the values.
Figure 8. Animation of [latex]y=ax^2+bc+c[/latex] as [a, b[/latex] and [latex]c[/latex] change.
Examples
Explain how the graph of the given equation is different from the graph of [latex]y=x^2[/latex].
- [latex]y=x^2-7[/latex]
- [latex]y=6x^2[/latex]
- [latex]y=-x^2+5[/latex]
- [latex]y=-\frac{1}{4}x^2+3[/latex]
- [latex]y=4x^2-8[/latex]
Solution
- Since [latex]a=1[/latex] the graph looks the same as [latex]y=x^2[/latex] but since [latex]c=-7[/latex] it has been moved vertically down by 7 units.
- Since [latex]a=6[/latex] the graph is thinner than [latex]y=x^2[/latex]. The [latex]y[/latex]-value is 6 times larger than [latex]y=x^2[/latex].
- Since [latex]a=-1[/latex] is negative the graph looks like an upside down version of [latex]y=x^2[/latex] and since [latex]c=5[/latex] it has also been moved vertically up by 5 units.
- Since [latex]a=-\frac{1}{4}[/latex] the graph is upside down compared to [latex]y=x^2[/latex], is broader than [latex]y=x^2[/latex], and since [latex]c=3[/latex] it has been moved vertically up by 3 units.
- Since [latex]a=4[/latex] the graph is thinner than [latex]y=x^2[/latex] and since [latex]c=-8[/latex]has been moved vertically down by 8 units.
Try It
Explain how the graph of the given equation is different from the graph of [latex]y=x^2[/latex].
- [latex]y=x^2-2[/latex]
- [latex]y=3x^2[/latex]
- [latex]y=-x^2-8[/latex]
- [latex]y=\frac{2}{3}x^2+5[/latex]
- [latex]y=2x^2+7[/latex]
Examples
Given the [latex]y[/latex]-intercepts of a parabola, determine the axis of symmetry.
- (-4, 0) and (0, 0)
- (2, 0) and (8, 0)
- (-3, 0) and (7, 0)
Solution
The axis of symmetry runs exactly halfway between the two intercepts.
- There are 4 units between -4 and 0, so the axis is 2 units away from both points: [latex]x=-2[/latex]
- There are 6 units between 2 and 8, so the axis is 3 units away from both points: [latex]x=5[/latex]
- There are 10 units between -3 and 7, so the axis is 5 units away from both points: [latex]x=2[/latex]
Try It
Given the [latex]y[/latex]-intercepts of a parabola, determine the axis of symmetry.
- (0, 0) and (4, 0)
- (-2, 0) and (4, 0)
- (-5, 0) and (1, 0)
Examples
Given two points on a parabola, determine the axis of symmetry.
- (3, 4) and (9, 4)
- (-2, 1) and (6, 1)
- (-2, -5) and (3, -5)
Solution
Since the [latex]y[/latex]-values are the same in both points, the points are twins and the axis of symmetry runs exactly halfway between them.
- There are 6 units between 3 and 9, so the axis is 3 units away from both points: [latex]x=6[/latex]
- There are 8 units between -2 and 6, so the axis is 4 units away from both points: [latex]x=2[/latex]
- There are 5 units between -2 and 3, so the axis is 2.5 units away from both points: [latex]x=1.5[/latex]
Try It
Given two points on a parabola, determine the axis of symmetry.
- (-2, 7) and (11, 7)
- (-8, 1) and (-4, 1)
- (-7, -8) and (1, -8)