Learning Objectives
- Find the maximum and minimum of a set of data values
- Find the range of a set of data values
- Find the median of a set of data values
- Find the mode of a set of data values
KEY TAKEAWAYS
- Maximum: the largest numerical value in a set of data
- Minimum: the smallest numerical value in a set of data
- Range: the difference between the maximum and minimum
- Median: the middle value of a set of data when it is listed in numerical order from its minimum to its maximum value
- Mode: the data value that occurs most often
- Bi-modal: having two modes
- Average: a single number that describes the central or typical value in a set of data
- Frequency: the number of times a data value occurs
Descriptive Statistics
A descriptive statistic is a number that numerically describes the set of data or summarizes features of the data set. A descriptive statistic can describe lowest or highest values of the data, an average value, the spread of the data, etc.
Maximum, Minimum, Range and Median
When data points are listed numerically from smallest to largest, the smallest value is the minimum, the largest value is the maximum, and the middle value is the median. In addition, the range, which is a measure of the spread of the data, is the difference of the maximum and the minimum values.
When Ann, Bianca, Dora, Eve, and Francine sing together on stage, they line up in order of their heights. Their heights, in inches, are shown in the table below.
| Table 1. The height in inches of singers. | |||||
| Name | Ann | Bianca | Dora | Eve | Francine |
|---|---|---|---|---|---|
| Height (inches) | [latex]59[/latex] | [latex]60[/latex] | [latex]65[/latex] | [latex]68[/latex] | [latex]70[/latex] |
Ann is the shortest, so the minimum height is [latex]59[/latex] inches. Francine is the tallest, so the maximum height is [latex]70[/latex] inches. This means that the range of their heights is [latex]70" - 59" = 11[\latex] inches. There is an 11 inch difference between the tallest and shortest in the group.
RANGE
The range of a set of data values is a measure of the spread of the data. Range = Maximum – Minimum
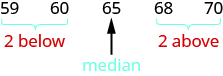
Dora is in the middle of the group. Her height, [latex]65[/latex] inches, is the median of the girls’ heights. Half of the heights are less than or equal to Dora’s height, and half are greater than or equal. The median is the middle value.
Median
The median of a set of data values is the middle value.
- Half the data values are less than or equal to the median.
- Half the data values are greater than or equal to the median.
What if Carmen, the pianist, joins the singing group on stage? Carmen is [latex]62[/latex] inches tall, so she fits in the height order between Bianca and Dora. Now the data set looks like this:
[latex]59,60,62,65,68,70[/latex]
There is no single middle value. The heights of the six girls can be divided into two equal parts.

Statisticians have agreed that in cases like this the median lies exactly half-way between the two values closest to the middle. So the median is exactly half-way between [latex]62[/latex] and [latex]65[/latex]. This half-way point can be found by adding the two closest values together and dividing by [latex]2[/latex]: [latex]{\frac{62+65}{2}}=63.5[/latex]. (In the next section we will see that this method is equivalent to finding the mean of the two values.) The median height is [latex]63.5[/latex] inches.

Notice that when the number of girls was [latex]5[/latex], the median was the third height, but when the number of girls was [latex]6[/latex], the median was the mean of the third and fourth heights. In general, when the number of values is odd, the median will be the one value in the middle, but when the number is even, the median will lie exactly halfway between the two middle values.
Find the median of a set of numbers.
- List the numbers from smallest to largest.
- Count how many numbers are in the set. Call this [latex]n[/latex].
- Is [latex]n[/latex] odd or even?
- If [latex]n[/latex] is an odd number, the median is the middle value.
- If [latex]n[/latex] is an even number, the median is exactly halfway between the closet two values to the middle.
example
Find the median of [latex]12,13,19,9,11,15,\text{and }18[/latex].
Solution
| List the numbers in order from smallest to largest. | [latex]9, 11, 12, 13, 15, 18, 19[/latex] |
| Count how many numbers are in the set. Call this [latex]n[/latex] . | [latex]n=7[/latex] |
| Is [latex]n[/latex] odd or even? | odd |
| The median is the middle value. | 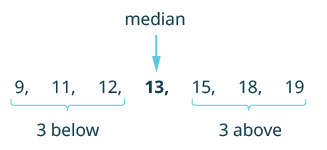 |
| The median is the number in the [latex]4[/latex]th position. | So the median of the data is [latex]13[/latex]. |
try it
example
Kristen received the following scores on her weekly math quizzes:
[latex]83,79,85,86,92,100,76,90,88,\text{and }64[/latex]. Find her median score.

try it
Mode
The median is an example of an average, which is a single number that describes the central or typical value in a set of data. Another average is the mode. The mode of a set of numbers is the number that occurs most often. The frequency, is the number of times a number occurs. So the mode of a set of numbers is the number with the highest frequency.
Mode
The mode of a set of values is the value with the highest frequency.
Suppose Jolene kept track of the number of miles she ran since the start of the month, as shown in the calendar below.
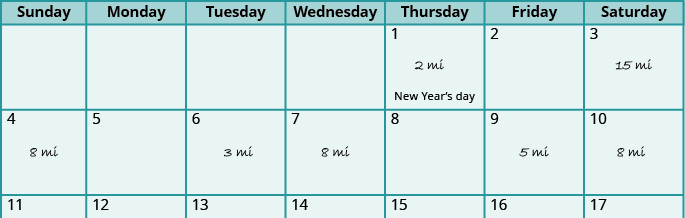
If we list the numbers in order it is easier to identify the one with the highest frequency.
[latex]2,3,5,8,8,8,15[/latex]
Jolene ran [latex]8[/latex] miles three times, and every other distance is listed only once. So the mode of the data is [latex]8[/latex] miles. Notice that, in this case, the mode and the median are both [latex]8[/latex] miles.
Identify the mode of a set of numbers.
- List the data values in numerical order.
- Count the number of times each value appears.
- The mode is the value with the highest frequency.
example
The ages of students in a college math class are listed below. Identify the mode.
[latex]18,18,18,18,19,19,19,20,20,20,20,20,20,20,21,21,22,22,22,22,22,23,24,24,25,29,30,40,44[/latex]
Solution
The ages are already listed in order. We will make a table of frequencies to help identify the age with the highest frequency.
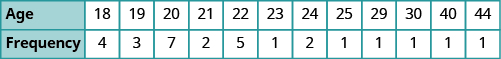
Now look for the highest frequency. The highest frequency is [latex]7[/latex], which corresponds to the age [latex]20[/latex]. So the mode of the ages in this class is [latex]20[/latex] years old.
TRY IT
1. Employees used the following number of sick days last year: [latex]3,6,2,3,7,5,6,2,4,2[/latex]. Identify the mode.
2. The number of handbags owned by women in a book club: [latex]5,6,3,1,5,8,1,5,8,5[/latex]. Identify the mode.
example
The data lists the heights (in inches) of students in a math class. Identify the mode.
| [latex]56[/latex] | [latex]61[/latex] | [latex]63[/latex] | [latex]64[/latex] | [latex]65[/latex] | [latex]66[/latex] | [latex]67[/latex] | [latex]67[/latex] |
| [latex]60[/latex] | [latex]62[/latex] | [latex]63[/latex] | [latex]64[/latex] | [latex]65[/latex] | [latex]66[/latex] | [latex]67[/latex] | [latex]70[/latex] |
| [latex]60[/latex] | [latex]63[/latex] | [latex]63[/latex] | [latex]64[/latex] | [latex]66[/latex] | [latex]66[/latex] | [latex]67[/latex] | [latex]74[/latex] |
| [latex]61[/latex] | [latex]63[/latex] | [latex]64[/latex] | [latex]65[/latex] | [latex]66[/latex] | [latex]67[/latex] | [latex]67[/latex] |

TRY IT
1. The ages of the students in a statistics class are listed: [latex]19[/latex] , [latex]20[/latex] , [latex]23[/latex] , [latex]23[/latex] , [latex]38[/latex] , [latex]21[/latex] , [latex]19[/latex] , [latex]21[/latex] , [latex]19[/latex] , [latex]21[/latex] , [latex]20[/latex] , [latex]43[/latex] , [latex]20[/latex] , [latex]23[/latex] , [latex]17[/latex] , [latex]21[/latex] , [latex]21[/latex] , [latex]20[/latex] , [latex]29[/latex] , [latex]18[/latex] , [latex]28[/latex] . What is the mode?
2. Students listed the number of members in their household as follows: [latex]6[/latex] , [latex]2[/latex] , [latex]5[/latex] , [latex]6[/latex] , [latex]3[/latex] , [latex]7[/latex] , [latex]5[/latex] , [latex]6[/latex] , [latex]5[/latex] , [latex]3[/latex] , [latex]4[/latex] , [latex]4[/latex] , [latex]5[/latex] , [latex]7[/latex] , [latex]6[/latex] , [latex]4[/latex] , [latex]5[/latex] , [latex]2[/latex] , [latex]1[/latex] , [latex]5[/latex] . What is the mode?
Some data sets do not have a mode because no value appears more than any other. And some data sets have more than one mode. In a given set, if two or more data values have the same highest frequency, we say they are all modes. When exactly 2 data values have the same highest frequency, we say the data is bi-modal.
Watch the following video for another example of how to find the mode of a data set.
Try It
Candela Citations
- Descriptive Statistics. Authored by: Hazel McKenna. Provided by: Utah Valley University. License: CC BY: Attribution
- Question ID 146419, 146418. Authored by: Lumen Learning. License: CC BY: Attribution
- Ex: Find the Median of a Data Set. Authored by: James Sousa (Mathispower4u.com) for Lumen Learning. Located at: https://youtu.be/CbKqFc-EPDs. License: CC BY: Attribution
- Adapted and revised: Prealgebra. Provided by: OpenStax. License: CC BY: Attribution