Learning Objectives
Type your learning objectives here.
- Graph a vertical line
- Give the equation of a vertical line
- Graph a horizontal line
- Give the equation of a horizontal line
Key words
Type your key takeaways here.
- vertical line: a line that runs in the same direction as the [latex]y[/latex]-axis
- horizontal line: a line that runs in the same direction as the [latex]x[/latex]-axis
Vertical and Horizontal Lines
Consider the vertical line graphed in figure 1, and the solution table that goes with it.

| [latex]x[/latex] | [latex]y[/latex] |
|---|---|
| 2 | -3 |
| 2 | -1 |
| 2 | 0 |
| 2 | 1 |
| 2 | 3 |
No matter the value of [latex]y[/latex], [latex]x=2[/latex]. So [latex]x=2[/latex] is the equation of the line.
Figure 1.
VERTICAL LINES
The equation of a vertical line is given as: [latex]x=c[/latex] where c is a constant.
To graph the equation on the coordinate plane, we need both [latex]x[/latex] and [latex]y[/latex] variables in the equation. Therefore, the equation of the vertical line in two variables is: [latex]x+0y=c[/latex] where c is a constant.
Consider the horizontal line graphed in figure 2, and the solution table that goes with it.

| [latex]x[/latex] | [latex]y[/latex] |
|---|---|
| -3 | 3 |
| -1 | 3 |
| 0 | 3 |
| 2 | 3 |
| 4 | 3 |
No matter the [latex]x[/latex]-value, the [latex]y[/latex]-value is always 3. So the equation of the line is [latex]y=3[/latex].
Figure 2.
HORIZONTAL LINES
The equation of a horizontal line is given as: [latex]y=c[/latex] where c is a constant.
To graph the equation on the coordinate plane, we need both [latex]x[/latex] and [latex]y[/latex] variables in the equation. Therefore, the equation of the horizontal line in two variables is [latex]0x+y=c[/latex].
Suppose we want to graph a the lines with equations [latex]x+0y=-3[/latex] and [latex]0x+y=-2[/latex].
The following points satisfy the first equation: [latex]\left(-3,-5\right),\left(-3,1\right),\left(-3,3\right)[/latex], and [latex]\left(-3,5\right)[/latex]. We can plot the points. Notice that all of the [latex]x[/latex]–coordinates are the same and we find a vertical line through [latex]x=-3[/latex].
The following points satisfy the second equation: [latex]\left(-2,-2\right),\left(0,-2\right),\left(3,-2\right)[/latex], and [latex]\left(5,-2\right)[/latex]. The graph is a horizontal line through [latex]y=-2[/latex]. Notice that all of the [latex]y[/latex]–coordinates are the same.
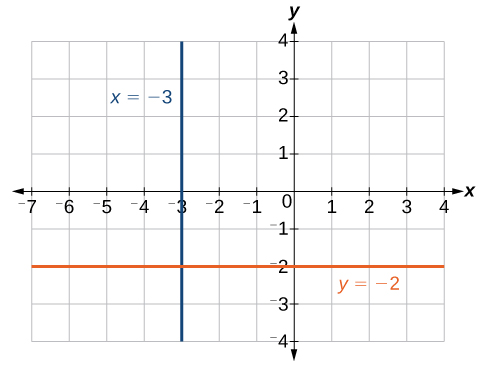 x = −3 is a vertical line.
y = −2 is a horizontal line.
try it
Use an online graphing tool to graph the following:
- A horizontal line that passes through the point (-5,2)
- A vertical line that passes through the point (3,3)
Example
Find the equation of the line passing through the given points: [latex]\left(1,-3\right)[/latex] and [latex]\left(1,4\right)[/latex].
Solution
The [latex]x[/latex]–coordinate of both points is 1. Therefore, we have a vertical line: [latex]x=1[/latex].
Try It
Find the equation of the line passing through [latex]\left(-5,2\right)[/latex] and [latex]\left(2,2\right)[/latex].
Candela Citations
- Revision and Adaptation. Provided by: Lumen Learning. License: CC BY: Attribution
- Figures 1 and 2.. Authored by: Hazel McKenna. Provided by: Utah Valley University. License: CC BY: Attribution
- College Algebra. Authored by: Abramson, Jay et al.. Provided by: OpenStax. Located at: http://cnx.org/contents/9b08c294-057f-4201-9f48-5d6ad992740d@5.2. License: CC BY: Attribution. License Terms: Download for free at http://cnx.org/contents/9b08c294-057f-4201-9f48-5d6ad992740d@5.2
- Question ID 1719. Authored by: Barbara Goldner. License: CC BY: Attribution. License Terms: IMathAS Community License CC- BY + GPL
- Question ID 110942, 110946, 110951, 110952. Authored by: Lumen Learning. License: CC BY: Attribution. License Terms: IMathAS Community License CC- BY + GPL
- College Algebra. Authored by: OpenStax College Algebra. Provided by: OpenStax. Located at: http://cnx.org/contents/9b08c294-057f-4201-9f48-5d6ad992740d@3.278:1/Preface. License: CC BY: Attribution