Learning Outcomes
- Use the slope formula to find the slope of a line between two points
- Find the slope of horizontal and vertical lines
The Slope Formula
We’ve seen that we can find the slope of a line on a graph by measuring the rise and the run. We can also find the slope of a line without its graph if we know the coordinates of any two points on that line. Every point has a set of coordinates: an [latex]x[/latex]-value and a [latex]y[/latex]-value, written as an ordered pair [latex](x, y)[/latex]. The [latex]x[/latex] value tells yus where a point is horizontally. The [latex]y[/latex] value tells us where the point is vertically.
Consider two points on a line—Point 1 and Point 2. Point 1 has coordinates [latex]\left(x_{1},y_{1}\right)[/latex] and Point 2 has coordinates [latex]\left(x_{2},y_{2}\right)[/latex].
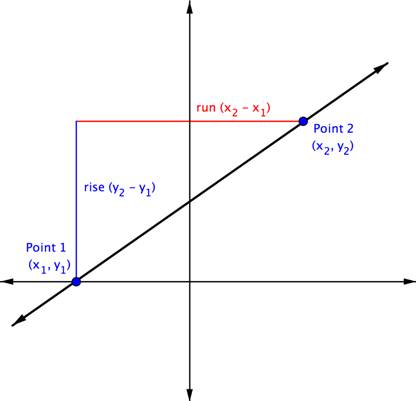
The rise is the vertical distance between the two points, which is the difference between their [latex]y[/latex]-coordinates. That makes the rise [latex]\left(y_{2}-y_{1}\right)[/latex]. The run between these two points is the difference in the [latex]x[/latex]-coordinates, or [latex]\left(x_{2}-x_{1}\right)[/latex].
So, [latex]\displaystyle \text{Slope}=\frac{\text{rise}}{\text{run}}[/latex] or [latex]\displaystyle m=\frac{{{y}_{2}}-{{y}_{1}}}{{{x}_{2}}-{{x}_{1}}}[/latex].
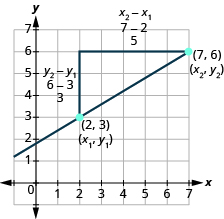
To see how the rise and run relate to the coordinates of the two points, let’s take a look at the slope of the line between the points [latex]\left(2,3\right)[/latex] and [latex]\left(7,6\right)[/latex].
Since we have two points, we will use subscript notation.
[latex]\stackrel{{x}_{1},{y}_{1}}{\left(2,3\right)}\stackrel{{x}_{2},{y}_{2}}{\left(7,6\right)}[/latex]
On the graph, we can count the rise of [latex]3[/latex]. The rise can also be found by subtracting the [latex]y\text{-coordinates}[/latex] of the points.
[latex]\begin{array}{c}{y}_{2}-{y}_{1}\\ 6 - 3\\ 3\end{array}[/latex]
We can count a run of [latex]5[/latex] from the graph. The run can also be found by subtracting the [latex]x\text{-coordinates}[/latex].
[latex]\begin{array}{c}{x}_{2}-{x}_{1}\\ 7 - 2\\ 5\end{array}[/latex]
| We know | [latex]m={\frac{\text{rise}}{\text{run}}}[/latex] |
| So | [latex]m={\frac{3}{5}}[/latex] |
| We rewrite the rise and run by putting in the coordinates. | [latex]m={\frac{6 - 3}{7 - 2}}[/latex] |
| But [latex]6[/latex] is the [latex]y[/latex] -coordinate of the second point, [latex]{y}_{2}[/latex]and [latex]3[/latex] is the [latex]y[/latex] -coordinate of the first point [latex]{y}_{1}[/latex] .
So we can rewrite the rise using subscript notation. |
[latex]m={\frac{{y}_{2}-{y}_{1}}{7 - 2}}[/latex] |
| Also [latex]7[/latex] is the [latex]x[/latex] -coordinate of the second point, [latex]{x}_{2}[/latex]and [latex]2[/latex] is the [latex]x[/latex] -coordinate of the first point [latex]{x}_{2}[/latex] .
So we rewrite the run using subscript notation. |
[latex]m={\frac{{y}_{2}-{y}_{1}}{{x}_{2}-{x}_{1}}}[/latex] |
We’ve shown that [latex]m={\frac{{y}_{2}-{y}_{1}}{{x}_{2}-{x}_{1}}}[/latex] is another version of [latex]m={\frac{\text{rise}}{\text{run}}}[/latex]. We can use this formula to find the slope of a line when we kmow two points on the line.
Slope Formula
The slope of the line between two points [latex]\left({x}_{1},{y}_{1}\right)[/latex] and [latex]\left({x}_{2},{y}_{2}\right)[/latex] is
[latex]m={\frac{{y}_{2}-{y}_{1}}{{x}_{2}-{x}_{1}}}[/latex]
example
Find the slope of the line between the points [latex]\left(1,2\right)[/latex] and [latex]\left(4,5\right)[/latex].
Solution
| We’ll call [latex]\left(1,2\right)[/latex] point #1 and [latex]\left(4,5\right)[/latex] point #2. | [latex]\stackrel{{x}_{1},{y}_{1}}{\left(1,2\right)}\text{and}\stackrel{{x}_{2},{y}_{2}}{\left(4,5\right)}[/latex] |
| Use the slope formula. | [latex]m={\frac{{y}_{2}-{y}_{1}}{{x}_{2}-{x}_{1}}}[/latex] |
| Substitute the values in the slope formula: | |
| [latex]y[/latex] of the second point minus [latex]y[/latex] of the first point | [latex]m={\frac{5 - 2}{{x}_{2}-{x}_{1}}}[/latex] |
| [latex]x[/latex] of the second point minus [latex]x[/latex] of the first point | [latex]m={\frac{5 - 2}{4 - 1}}[/latex] |
| Simplify the numerator and the denominator. | [latex]m={\frac{3}{3}}[/latex] |
| [latex]m=1[/latex] |
Let’s confirm this by counting out the slope on the graph.
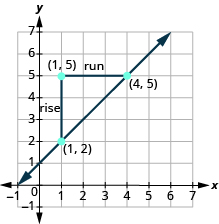
The rise is [latex]3[/latex] and the run is [latex]3[/latex], so
[latex]\begin{array}{}\\ m=\frac{\text{rise}}{\text{run}}\hfill \\ m={\Large\frac{3}{3}}\hfill \\ m=1\hfill \end{array}[/latex]
It is important to remember that the slope is the same no matter which order we select the points. Previously, whenever we found the slope by looking at the graph, we always selected our points from left to right so that our run was always a positive value. Now, let’s take a look at an example in which we select our points from right to left.
The point [latex](0,2)[/latex] is indicated as Point 1, and [latex](−2,6)[/latex] as Point 2. So you are going to move from Point 1 to Point 2. A triangle is drawn in above the line to help illustrate the rise and run.
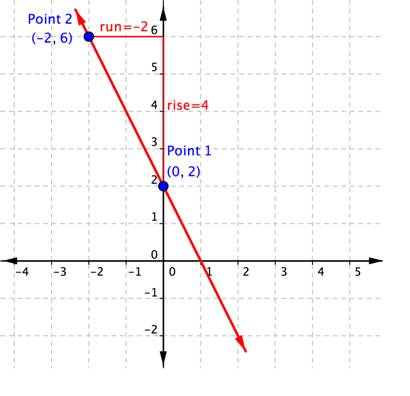
We can see from the graph that the rise going from Point 1 to Point 2 is [latex]4[/latex], because we are moving [latex]4[/latex] units in a positive direction (up). The run is [latex]−2[/latex], because we are moving in a negative direction (left) [latex]2[/latex] units. Using the slope formula,
[latex]\displaystyle \text{Slope}=\frac{\text{rise}}{\text{run}}=\frac{4}{-2}=-2[/latex].
We do not need the graph to find the slope. We can just use the coordinates, keeping careful track of which is Point 1 and which is Point 2. Let’s organize the information about the two points:
| Name | Ordered Pair | Coordinates |
|---|---|---|
| Point 1 | [latex](0,2)[/latex] | [latex]\begin{array}{l}x_{1}=0\\y_{1}=2\end{array}[/latex] |
| Point 2 | [latex](−2,6)[/latex] | [latex]\begin{array}{l}x_{2}=-2\\y_{2}=6\end{array}[/latex] |
The slope, [latex]m=\frac{y_{2}-y_{1}}{x_{2}-x_{1}}=\frac{6-2}{-2-0}=\frac{4}{-2}=-2[/latex]. The slope of the line, m, is [latex]−2[/latex].
Remember, it doesn’t matter which point is designated as Point 1 and which is Point 2. We could have called [latex](−2,6)[/latex] Point 1, and [latex](0,2)[/latex] Point 2. In that case, putting the coordinates into the slope formula produces the equation [latex]m=\frac{2-6}{0-\left(-2\right)}=\frac{-4}{2}=-2[/latex]. Once again, the slope is [latex]m=-2[/latex]. That’s the same slope as before. The important thing is to be consistent when we subtract: we must always subtract in the same order [latex]\left(y_{2}-y_{1}\right)[/latex] and [latex]\left(x_{2}-x_{1}\right)[/latex].
try it
example
Find the slope of the line through the points [latex]\left(-2,-3\right)[/latex] and [latex]\left(-7,4\right)[/latex].
Solution
| We’ll call [latex]\left(-2,-3\right)[/latex] point #1 and [latex]\left(-7,4\right)[/latex] point #2. | [latex]\stackrel{{x}_{1},{y}_{1}}{\left(-2,-3\right)}\text{and}\stackrel{{x}_{2},{y}_{2}}{\left(-7,4\right)}[/latex] |
| Use the slope formula. | [latex]m={\Large\frac{{y}_{2}-{y}_{1}}{{x}_{2}-{x}_{1}}}[/latex] |
| Substitute the values | |
| [latex]y[/latex] of the second point minus [latex]y[/latex] of the first point | [latex]m={\Large\frac{4-\left(-3\right)}{{x}_{2}-{x}_{1}}}[/latex] |
| [latex]x[/latex] of the second point minus [latex]x[/latex] of the first point | [latex]m={\Large\frac{4-\left(-3\right)}{-7-\left(-2\right)}}[/latex] |
| Simplify. | [latex]m={\Large\frac{7}{-5}}[/latex] |
| [latex]m=-{\Large\frac{7}{5}}[/latex] |
Let’s confirm this on the graph shown.

[latex]\begin{array}{}\\ \\ \\ m=\frac{\text{rise}}{\text{run}}\\ m={\Large\frac{-7}{5}}\\ m=-{\Large\frac{7}{5}}\end{array}[/latex]
try it
Example
What is the slope of the line that contains the points [latex](4,2)[/latex] and [latex](5,5)[/latex]?
Solution
| [latex]\begin{array}{l}x_{1}=4\\y_{1}=2\end{array}[/latex] | [latex]\left(4,2\right)=\text{Point }1,\left(x_{1},y_{1}\right)[/latex] |
| [latex]\begin{array}{l}x_{2}=5\\y_{2}=5\end{array}[/latex] | [latex]\left(5,5\right)=\text{Point }2,\left(x_{2},y_{2}\right)[/latex] |
| [latex]\begin{array}{l}m=\frac{y_{2}-y_{1}}{x_{2}-x_{1}}=\frac{5-2}{5-4}=\frac{3}{1}\\\\m=3\end{array}[/latex] | Substitute the values into the slope formula and simplify. |
Answer
The slope is [latex]3[/latex].
The example below shows the solution when we reverse the order of the points, calling [latex](5,5)[/latex] Point 1 and [latex](4,2)[/latex] Point 2.
Example
What is the slope of the line that contains the points [latex](5,5)[/latex] and [latex](4,2)[/latex]?
Solution
| [latex]\begin{array}{l}x_{1}=5\\y_{1}=5\end{array}[/latex] | [latex](5,5)=\text{Point }1[/latex], [latex]\left(x_{1},y_{1}\right)[/latex] |
| [latex]\begin{array}{l}x_{2}=4\\y_{2}=2\end{array}[/latex] | [latex](4,2)=\text{Point }2[/latex], [latex]\left(x_{2},y_{2}\right)[/latex] |
| [latex]\begin{array}{l}m=\frac{y_{2}-y_{1}}{{x_2}-x_{1}}\\\\m=\frac{2-5}{4-5}=\frac{-3}{-1}=3\\\\m=3\end{array}[/latex] | Substitute the values into the slope formula and simplify. |
Answer
The slope is [latex]3[/latex].
Notice that regardless of which ordered pair is named Point 1 and which is named Point 2, the slope is still [latex]3[/latex].
Example
What is the slope of the line that contains the points [latex](3,-6.25)[/latex] and [latex](-1,8.5)[/latex]?
Solution
| [latex]\begin{array}{l}x_{1}=3\\y_{1}=-6.25\end{array}[/latex] | [latex](3,-6.25)=\text{Point }1[/latex], [latex]\displaystyle ({{x}_{1}},{{y}_{1}})[/latex] |
| [latex]\displaystyle \begin{array}{l}{{x}_{2}}=-1\\{{y}_{2}}=8.5\end{array}[/latex] | [latex](-1,8.5)=\text{Point }2[/latex], [latex]\displaystyle ({{x}_{2}},{{y}_{2}})[/latex] |
| [latex]\displaystyle \begin{array}{l}m=\frac{{{y}_{2}}-{{y}_{1}}}{{{x}_{2}}-{{x}_{1}}}\\\\m=\frac{8.5-(-6.25)}{-1-3}\\\\m=\frac{14.75}{-4}\\\\m=-3.6875\end{array}[/latex] | Substitute the values into the slope formula and simplify. |
Answer
The slope is [latex]-3.6875[/latex]
Try It
What is the slope of the line that contains the points [latex](0,-\frac{2}{3})[/latex] and [latex](-1,\frac{5}{2})[/latex]?
Watch these videos to see more examples of how to determine slope given two points on a line.
Horizontal and Vertical Lines
Now, let’s revisit horizontal and vertical lines. So far in this section, we have considered lines that run “uphill” or “downhill.” Their slopes are always positive or negative numbers. But what about horizontal and vertical lines? Can we still use the slope formula to calculate their slopes?
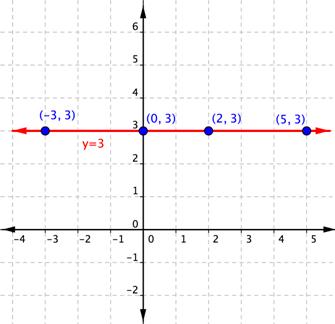
Consider the line above. We learned in the previous section that because it is horizontal, its slope is [latex]0[/latex]. We can also use the slope formula with two points on this horizontal line to calculate the slope of this horizontal line. Using [latex](−3,3)[/latex] as Point 1 and (2, 3) as Point 2, we get:
[latex]\displaystyle \begin{array}{l}m=\frac{{{y}_{2}}-{{y}_{1}}}{{{x}_{2}}-{{x}_{1}}}\\\\m=\frac{3-3}{2-\left(-3\right)}=\frac{0}{5}=0\end{array}[/latex]
The slope of this horizontal line is [latex]0[/latex].
Let’s consider any horizontal line. No matter which two points we choose on the line, they will always have the same [latex]y[/latex]-coordinate. So, when we apply the slope formula, the numerator will always be [latex]0[/latex]. Zero divided by any non-zero number is [latex]0[/latex], so the slope of any horizontal line is always [latex]0[/latex].
The equation for the horizontal line [latex]y=3[/latex] is telling you that no matter which two points you choose on this line, the y-coordinate will always be [latex]3[/latex].
How about vertical lines? In their case, no matter which two points we choose, they will always have the same [latex]x[/latex]-coordinate. The equation for this line is [latex]x=2[/latex].
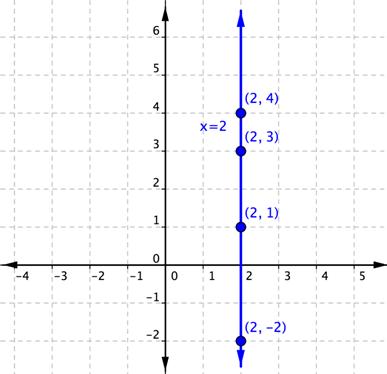
So, what happens when we use the slope formula with two points on this vertical line to calculate the slope? Using [latex](2,1)[/latex] as Point 1 and [latex](2,3)[/latex] as Point 2, we get:
[latex]\displaystyle \begin{array}{l}m=\frac{{{y}_{2}}-{{y}_{1}}}{{{x}_{2}}-{{x}_{1}}}\\\\m=\frac{3-1}{2-2}=\frac{2}{0}\end{array}[/latex]
But division by zero has no meaning for the set of real numbers. Because of this fact, it is said that the slope of this vertical line is undefined. This is true for all vertical lines—they all have a slope that is undefined.
Example
What is the slope of the line that contains the points [latex](3,2)[/latex] and [latex](−8,2)[/latex]?
Solution
| [latex]\displaystyle \begin{array}{l}{{x}_{1}}=3\\{{y}_{1}}=2\end{array}[/latex] | [latex](3,2)=\text{Point }1[/latex], [latex]\displaystyle \left(x_{1},x_{2}\right)[/latex] |
| [latex]\displaystyle \begin{array}{l}{{x}_{2}}=-8\\\\{{y}_{2}}=2\end{array}[/latex] | [latex](−8,2)=\text{Point }2[/latex], [latex]\displaystyle ({{x}_{2}},{{y}_{2}})[/latex] |
| [latex]\displaystyle \begin{array}{l}\frac{{{y}_{2}}-{{y}_{1}}}{{{x}_{2}}-{{x}_{1}}}\\\\\frac{(2)-(2)}{(-8)-(3)}=\frac{0}{-11}=0\\\\m=0\end{array}[/latex] | Substitute the values into the slope formula and simplify. |
Answer
The slope is [latex]0[/latex], so the line is horizontal.
Try It
Candela Citations
- Question ID 147022, 147021, 147020. Authored by: Lumen Learning. License: CC BY: Attribution
- Ex 2: Determine the Slope a Line Given Two Points on a Line. Authored by: James Sousa (mathispower4u.com). Located at: https://youtu.be/6qONExlVGgc. License: CC BY: Attribution
- Prealgebra. Provided by: OpenStax. License: CC BY: Attribution. License Terms: Download for free at http://cnx.org/contents/caa57dab-41c7-455e-bd6f-f443cda5519c@9.757