Learning Outcomes
- Graph a system of linear equations in two variables.
- Determine the solution of a system of equations graphically.
- Determine the type of system from the graph.
Key words
- Parallel lines: lines that have the same slope but different [latex]y[/latex]-intercepts
- Coinciding lines: lines that have the same slope and the same[latex]y[/latex]-intercept
Graph a system of linear equations
There are multiple methods for solving systems of linear equations. For a system of linear equations in two variables, we can visually determine both the type of system and the solution by graphing the system of equations on the same set of axes.
We will practice graphing two equations on the same set of axes, and explore the considerations required when graphing two linear inequalities on the same set of axes. The same techniques are used to graph a system of linear equations as as we used to graph single linear equations. We can use tables of values, slope and [latex]y[/latex]-intercept, or [latex]x[/latex]– and [latex]y[/latex]-intercepts to graph each line on the same set of axes.
Example
Solve the following system of equations by graphing. Identify the type of system.
[latex]\begin{array}{c}2x+y=-8\\ x-y=-1\end{array}[/latex]
Solution
To graph an equation in the form [latex]ax+by=c[/latex], we can find the intercepts.
Equation 1: [latex]2x+y=-8[/latex]
Set [latex]x=0[/latex] then [latex]y=-8[/latex]. [latex]\left (0, -8\right )[/latex] is the [latex]y[/latex]-intercept.
Set [latex]y=0[/latex] then [latex]2x=-8[/latex], so [latex]x=-4[/latex]. [latex]\left (-4, 0\right )[/latex] is the [latex]x[/latex]-intercept.
Equation 2: [latex]x-y=-1[/latex]
Set [latex]x=0[/latex] then [latex]-y=-1[/latex], so [latex]y=1[/latex]. [latex]\left (0, 1\right )[/latex] is the [latex]y[/latex]-intercept.
Set [latex]y=0[/latex] then [latex]x=-1[/latex]. [latex]\left (-4, 0\right )[/latex] is the [latex]x[/latex]-intercept.
Graph both equations on the same set of axes.
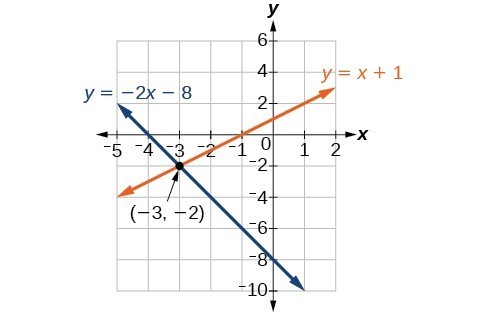
The lines appear to intersect at the point [latex]\left(-3,-2\right)[/latex]. We can check to make sure that this is the solution to the system by substituting the ordered pair into both equations
[latex]\begin{array}{ll}2\left(-3\right)+\left(-2\right)=-8\hfill & \hfill \\ \text{ }-8=-8\hfill & \text{True}\hfill \\ \text{ }\left(-3\right)-\left(-2\right)=-1\hfill & \hfill \\ \text{ }-1=-1\hfill & \text{True}\hfill \end{array}[/latex]
The solution to the system is the ordered pair [latex]\left(-3,-2\right)[/latex].
The system is independent since we have two lines crossing at a single point.
Watch the video below for another example of how to solve a system of equations by first graphing the lines and then identifying the solution the system has.
Try It
Example
Graph the system [latex]\begin{array}{c}y=2x+1\\y=2x-3\end{array}[/latex]. Identify the type of system
Solution
First, graph [latex]y=2x+1[/latex] using the slope [latex]m = 2[/latex] and the [latex]y[/latex]-intercept [latex](0,1)[/latex].

Next, graph [latex]y=2x-3[/latex] using the slope [latex]m = 2[/latex], and the [latex]y[/latex]-intercept [latex](0,-3)[/latex].

These are parallel lines, and they don’t cross. Consequently, there are no solutions to this system of equations.
This is an inconsistent system.
Example
Graph the system [latex]\begin{array}{c}y=\frac{1}{2}x+2\\2y-x=4\end{array}[/latex]. Identify the type of system.
Solution
Equation 1: [latex]y=\frac{1}{2}x+2[/latex] has a slope of [latex]m=\frac{1}{2}[/latex] and a [latex]y[/latex]-intercept at [latex](0,2)[/latex]. We plot the point [latex]\left ( 0,2\right )[/latex], then use the slope with a riuse of [latex]1[/latex] and a run of [latex]2[/latex] to find another point on the line [latex]\left (2,3\right )[/latex].

Equation 2, [latex]2y-x=4[/latex]is written in the form [latex]ax+by=c[/latex] so it is easiest to find the the intercepts.
Substitute [latex]y = 0[/latex] in to the equation to find the [latex]x[/latex]-intercept.
[latex]\begin{array}{c}2y-x=4\\2\left(0\right)-x=4\\x=-4\end{array}[/latex]
The [latex]x[/latex]-intercept of [latex]2y-x=4[/latex] is [latex]\left(-4,0\right)[/latex].
Now substitute [latex]x = 0[/latex] into the equation to find the y-intercept.
[latex]\begin{array}{c}2y-x=4\\2y-0=4\\2y=4\\y=2\end{array}[/latex]
The [latex]y[/latex]-intercept of [latex]2y-x=4[/latex] is [latex]\left(0,2\right)[/latex].
WAIT, these are exactly the same lines! In fact, [latex]y=\frac{1}{2}x+2[/latex] and [latex]2y-x=4[/latex] are really the same equation, expressed in different ways. If we were to write them both in slope-intercept form we would see that they are the same equation.
Systems with identical equations have an infinite number of solutions that lie on the line and are classified as a dependent system.
The solutions can be written in set builder notation: [latex]\{\;\left (x, y\right )\;\large | \normalsize \;y=\frac{1}{2}x+2\;\}[/latex].
They can also be written as a set of ordered pairs where [latex]y[/latex] is written in term of [latex]x[/latex]: [latex]\left (x,\frac{1}{2}x+2\right )[/latex].
As demonstrated by the examples above, graphing can be used if the system is inconsistent or dependent. In both cases, we can still graph the system to determine the type of system and solution. If the two lines are parallel, the system has no solution and is inconsistent. If the two lines coincide, the system has infinite solutions on the line and the system is dependent.
Try It
Graph the system [latex]\begin{array}{c}y=2x+2\\y-2x=4\end{array}[/latex]. Identify the type of system.
Try It
Graph the system [latex]\begin{array}{c}y=3x+2\\y+3x=2\end{array}[/latex]. Identify the type of system.

The video below provides more examples of how to graph systems of linear equations.
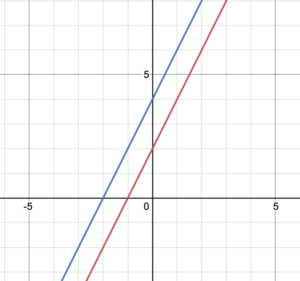
Solving a system of linear equations in two variables is visually appealing but it has one major flaw; the two lines may cross at a point that is not obvious. For example, the solution of the system of equations graphed in Figure 1 is not obvious.

Figure 1.
[latex]2x+y=5\\3x-y=2[/latex]
The solution is [latex](1.4,2.2)[/latex] but that is not obvious from the graph. Consequently, algebraic methods are required to solve systems of equations.
Candela Citations
- Revision and Adaptation. Provided by: Lumen Learning. License: CC BY: Attribution
- Graphing a System of Linear Equation. Authored by: James Sousa (Mathispower4u.com) for Lumen Learning. Located at: https://youtu.be/BBmB3rFZLXU. License: CC BY: Attribution
- Figure 1; Try It hjm209; hjm306. Authored by: Hazel McKenna. Provided by: Utah Valley University. License: CC BY: Attribution
- Unit 14: Systems of Equations and Inequalities, from Developmental Math: An Open Program. Provided by: Monterey Institute of Technology and Education. License: CC BY: Attribution
- Ex 1: Graph a System of Linear Inequalities Mathispower4u Mathispower4u. Authored by: James Sousa (Mathispower4u.com) for Lumen Learning. Located at: https://youtu.be/ACTxJv1h2_c. License: CC BY: Attribution