Learning Objectives
- Describe a quadratic equation
- Look for patterns in quadratic growth
- Graph the quadratic equation [latex]y=x^2[/latex]
KEYWORDS
- Quadratic: a degree two polynomial of the form [latex]ax^2+bx+c[/latex] where [latex]a, b, c[/latex] are real numbers with [latex]a\ne0[/latex]
- Quadratic equation in 2 variables: a degree two equation of the [latex]y=ax^2+bx+c=0[/latex] where [latex]a, b, c[/latex] are real numbers with [latex]a\ne0[/latex]
- Parabola: the shape of the graph of a quadratic equation [latex]y=ax^2+bx+c[/latex]
- Line of symmetry: a line that separates mirror images of each side of a graph
- Vertex: the turning point of a parabola
Quadratic Equations and Solutions
The single defining feature of a quadratic is that it is a polynomial of degree two in one variable. This means it takes the form [latex]ax^2+bx+c[/latex], where [latex]a, b, c[/latex] are real numbers with [latex]a\ne0[/latex]. If we introduce a second variable [latex]y[/latex] and set it equal to a quadratic, we get a quadratic equation of the form [latex]y=ax^2+bx+c[/latex]. SInce a quadratic equation has two variables, [latex]x[/latex] and [latex]y[/latex], the solutions will be ordered pairs [latex](x, y)[/latex].
We can discover solutions to a quadratic equations by picking values for [latex]x[/latex] and finding the corresponding [latex]y[/latex]-values.
Example
Determine the solutions to [latex]y=3x^2-4x+1[/latex] when,
- [latex]x=1[/latex]
- [latex]x=0[/latex]
- [latex]x=-2[/latex]
Solution
1. [latex]y=3x^2-4x+1[/latex] Plug in [latex]x=1[/latex]
[latex]\;\;y=3(1)^2-4(1)+1=3-4+1=0[/latex]
[latex]\;\;(1, 0)[/latex] is a solution.
2. [latex]y=3x^2-4x+1[/latex] Plug in [latex]x=0[/latex]
[latex]\;\;y=3(0)^2-4(0)+1=0-0+1=1[/latex]
[latex]\;\;(0, 1)[/latex] is a solution.
3. [latex]y=3x^2-4x+1[/latex] Plug in [latex]x=-2[/latex]
[latex]\;\;y=3(-2)^2-4(-2)+1=3(4)+8+1=12+8+1=21[/latex]
[latex]\;\;(-2, 21)[/latex] is a solution.
Try It
Determine the solutions to [latex]y=-2x^2+3x-5[/latex] when,
- [latex]x=1[/latex]
- [latex]x=3[/latex]
- [latex]x=-2[/latex]
Patterns in Quadratic Growth
In order to look at patterns within quadratic equations, we will begin by examining the simplest form of a quadratic equation: [latex]y=x^2[/latex]. By examining this particular equation, we can extrapolate information to make generalizations for all quadratic equations.
Given an [latex]x[/latex]-value, we can find the corresponding [latex]y[/latex]-value by plugging in the [latex]x[/latex]-value to the equation [latex]y=x^2[/latex].
The following table represents solutions of the equation [latex]y=x^2[/latex].
| [latex]x[/latex] | [latex]y[/latex] |
| [latex]-3[/latex] | [latex]9[/latex] |
| [latex]-2[/latex] | [latex]4[/latex] |
| [latex]-1[/latex] | [latex]1[/latex] |
| [latex]0[/latex] | [latex]0[/latex] |
| [latex]1[/latex] | [latex]1[/latex] |
| [latex]2[/latex] | [latex]4[/latex] |
| [latex]3[/latex] | [latex]9[/latex] |
Table 1. Table of values of [latex]y=x^2[/latex]
In a linear equation, like [latex]y=mx+b[/latex], a one unit increase in [latex]x[/latex] corresponds to a constant change in [latex]y[/latex]. However, the table of values shows us that for a change of [latex]+1[/latex] in the [latex]x[/latex]-value, the change in the [latex]y[/latex]-value is not constant.
For example if [latex]x[/latex] increases one unit from [latex]1[/latex] to [latex]2[/latex], the corresponding change in the value of [latex]y[/latex] is [latex]+3[/latex]. However, if [latex]x[/latex] increases one unit from [latex]2[/latex] to [latex]3[/latex], the corresponding change in the value of [latex]y[/latex] is [latex]+5[/latex]. This demonstrates that the rate of change is not always the same, thus this change is non-linear. The growth demonstrated in the above table is called quadratic growth.

Figure 1: The change in [latex]y[/latex] for the quadratic equation [latex]y=x^2[/latex] from [latex]x = 1 \text{ to } x = 2[/latex]. |

Figure 2: The change in [latex]y[/latex] for the quadratic equation [latex]y=x^2[/latex] from [latex]x = 2 \text{ to } x = 3[/latex]. |
Another pattern in quadratic growth comes from squaring real numbers. If a real number is squared, the result is always positive. Thus if the [latex]x[/latex]-value is positive or negative, the corresponding [latex]y[/latex]-value is always positive. If we consider [latex]x=2[/latex] this gives us a corresponding [latex]y[/latex]-value of [latex]4[/latex]. The [latex]x[/latex]-value of [latex]-2[/latex] also gives us a corresponding [latex]y[/latex]-value of [latex]4[/latex]. This property of squaring leads to a symmetry within quadratic growth. It gives us symmetrical points on the graph of any quadratic equation. Two sets of symmetrical points are demonstrated in the following table.
| [latex]x[/latex] | [latex]y=x^2[/latex] | [latex]x[/latex] | [latex]y=x^2[/latex] |
| [latex]-4[/latex] | [latex]16[/latex] | [latex]-5[/latex] | [latex]25[/latex] |
| [latex]4[/latex] | [latex]16[/latex] | [latex]5[/latex] | [latex]25[/latex] |
Graphing [latex]y=x^2[/latex] from a Table of Values
Using the table of values for the equation [latex]y=x^2[/latex] above, we can plot these points in order to see part of the simplest quadratic equation.

Figure 3: Graph of the quadratic equation [latex]y=x^2[/latex] from Table 1.
By connecting the points, the shape of a quadratic equation becomes clearer. This slightly U-shape is indicative of all quadratic equations, and is called a parabola.

Figure 4: The graph of the equation [latex]y=x^2[/latex].
From this graph it is clear that a parabola has symmetry. The line that runs vertically through the middle of the parabola and separates the two symmetrical sides of the parabola is called the line of symmetry. For the graph of [latex]y=x^2[/latex], the line of symmetry is the vertical line with equation [latex]x=0[/latex].
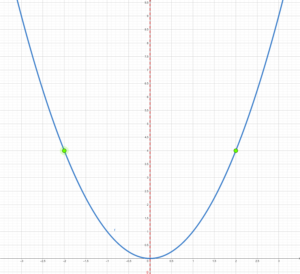
Figure 5: Quadratic Equation with the Line of Symmetry and Symmetrical Points
In Figure 5, we can see the line of symmetry in red and how it splits the parabola into two mirror image halves. On both sides of the line of symmetry are corresponding points that are also symmetric to one another.
Example
1. What point is symmetric to [latex](-3, 9)[/latex] on the graph of [latex]y=x^2[/latex]?
2. What point is symmetric to [latex](5, 25)[/latex] on the graph of [latex]y=x^2[/latex]?
3. What point is symmetric to [latex](0, 0)[/latex] on the graph of [latex]y=x^2[/latex]?
Solution

- [latex](-3, 9)[/latex] has a symmetric point at [latex](3, 9)[/latex].
- [latex](5, 25)[/latex] has a symmetric point at [latex](-5, 25)[/latex].
- [latex](0, 0)[/latex] has a symmetric point at [latex](0, 0)[/latex].
Try It
1. What point is symmetric to [latex](-4, 16)[/latex] on the graph of [latex]y=x^2[/latex]?
2. What point is symmetric to [latex](2, 4)[/latex] on the graph of [latex]y=x^2[/latex]?
3. What point is symmetric to [latex](7, 49)[/latex] on the graph of [latex]y=x^2[/latex]?
Notice also, that the graph of [latex]y=x^2[/latex] has a turning point at [latex](0, 0)[/latex]. The turning point of a parabola is called the vertex.
Candela Citations
- Revision and Adaptation. Authored by: Roxanne Brinkerhoff and Hazel McKenna. Provided by: Utah Valley University. License: CC BY: Attribution
- All Examples ; Try It hjm572; hjm152. License: Public Domain: No Known Copyright
- College Algebra. Authored by: Abramson, Jay et al.. Provided by: OpenStax. Located at: http://cnx.org/contents/9b08c294-057f-4201-9f48-5d6ad992740d@5.2. License: CC BY: Attribution