Learning Objectives
- Describe the basic anatomy of the visual system
- Describe how light waves enable vision
Anatomy of the Visual System
The eye is the major sensory organ involved in vision (Figure 1). There are several parts of the eye from the front to the back side, including the cornea, pupil, iris, lens, retina, fovea, and optic nerve. The cornea, pupil, iris, and lens are situated toward the front of the eye. At the back are the retina, fovea, and optic nerve. The slideshow (in Figure 1) below shows those parts, one at a time, along with a brief description. You will get to practice at the end of the slide.
Figure 1. The anatomy of the eye is illustrated in this activity.
Now let us dive into each of the parts in detail.
Cornea
The cornea is the transparent covering over the eye. It serves as a barrier between the inner eye and the outside world, and it is involved in focusing light waves that enter the eye. Light waves are transmitted across the cornea and enter the eye through the pupil.
Pupil
The pupil is the small opening in the eye through which light passes, and the size of the pupil can change as a function of light levels as well as emotional arousal. When light levels are low, the pupil will become dilated, or expanded, to allow more light to enter the eye. When light levels are high, the pupil will constrict, or become smaller, to reduce the amount of light that enters the eye.
Iris
The iris is the colored portion of the eye. It is connected to the muscles that control the pupil’s size.
Lens
The lens is a curved, transparent structure that serves to provide additional focus for light entering the eye. Light crosses the lens after passing through the pupil. The lens is attached to muscles that can change its shape to aid in focusing light that is reflected from near or far objects.
Retina
The retina is the light-sensitive lining of the eye located at the back of the eye.
Fovea
The fovea, which is part of the retina, is a small indentation in the back of the eye. In a normal-sighted individual, the lens will focus images perfectly on fovea. The fovea contains densely packed specialized photoreceptor cells, known as cones, which are light-detecting cells. Another type of photoreceptor is rods. See Figure 2.

Figure 2. The two types of photoreceptors are shown in this image. Cones are colored green and rods are blue.
The cones are specialized types of photoreceptors that work best in bright light conditions. Cones are very sensitive to acute detail and provide tremendous spatial resolution. They also are directly involved in our ability to perceive color.
While cones are concentrated in the fovea, where images tend to be focused, rods, another type of photoreceptor, are located throughout the remainder of the retina. Rods are specialized photoreceptors that work well in low light conditions, and while they lack the spatial resolution and color function of the cones, they are involved in our vision in dimly lit environments as well as in our perception of movement on the periphery of our visual field.
We have all experienced the different sensitivities of rods and cones when making the transition from a brightly lit environment to a dimly lit environment. Imagine going to see a blockbuster movie on a clear summer day. As you walk from the brightly lit lobby into the dark theater, you notice that you immediately have difficulty seeing much of anything. After a few minutes, you begin to adjust to the darkness and can see the interior of the theater. In the bright environment, your vision was dominated primarily by cone activity. As you move to the dark environment, rod activity dominates, but there is a delay in transitioning between the phases. If your rods do not transform light into nerve impulses as easily and efficiently as they should, you will have difficulty seeing in dim light, a condition known as night blindness.
Rods and cones are connected (via several interneurons) to retinal ganglion cells. Axons from the retinal ganglion cells converge and exit through the back of the eye to form the optic nerve.
Optic Nerve
Rods and cones are connected (via several interneurons) to retinal ganglion cells (see Figure 2 again). Axons from the retinal ganglion cells converge and exit through the back of the eye to form the optic nerve. The optic nerve carries visual information from the retina to the brain. There is a point in the visual field called the blind spot (not shown in Figure 1): Even when light from a small object is focused on the blind spot, we do not see it. We are not consciously aware of our blind spots for two reasons: First, each eye gets a slightly different view of the visual field; therefore, the blind spots do not overlap. Second, our visual system fills in the blind spot so that although we cannot respond to visual information that occurs in that portion of the visual field, we are also not aware that information is missing.
The eye is the major sensory organ involved in vision (Figure 1). Light waves are transmitted across the cornea and enter the eye through the pupil. The cornea is the transparent covering over the eye. It serves as a barrier between the inner eye and the outside world, and it is involved in focusing light waves that enter the eye. The pupil is the small opening in the eye through which light passes, and the size of the pupil can change as a function of light levels as well as emotional arousal. When light levels are low, the pupil will become dilated, or expanded, to allow more light to enter the eye. When light levels are high, the pupil will constrict, or become smaller, to reduce the amount of light that enters the eye. The pupil’s size is controlled by muscles that are connected to the iris, which is the colored portion of the eye.
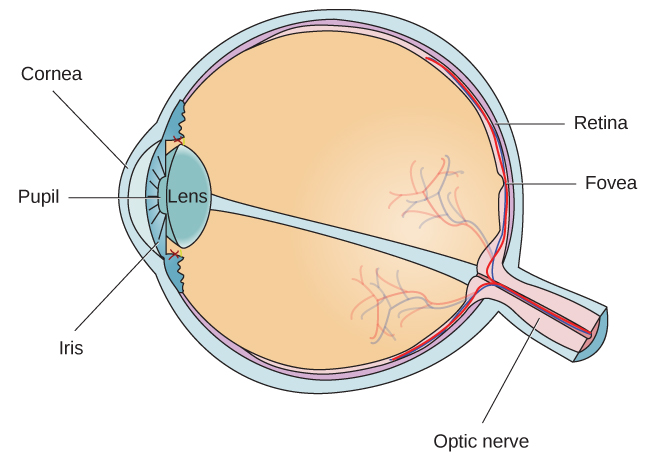
Figure 1. The anatomy of the eye is illustrated in this diagram.
After passing through the pupil, light crosses the lens, a curved, transparent structure that serves to provide additional focus. The lens is attached to muscles that can change its shape to aid in focusing light that is reflected from near or far objects. In a normal-sighted individual, the lens will focus images perfectly on a small indentation in the back of the eye known as the fovea, which is part of the retina, the light-sensitive lining of the eye. The fovea contains densely packed specialized photoreceptor cells (Figure 2). These photoreceptor cells, known as cones, are light-detecting cells. The cones are specialized types of photoreceptors that work best in bright light conditions. Cones are very sensitive to acute detail and provide tremendous spatial resolution. They also are directly involved in our ability to perceive color.
While cones are concentrated in the fovea, where images tend to be focused, rods, another type of photoreceptor, are located throughout the remainder of the retina. Rods are specialized photoreceptors that work well in low light conditions, and while they lack the spatial resolution and color function of the cones, they are involved in our vision in dimly lit environments as well as in our perception of movement on the periphery of our visual field.
Figure 2. The two types of photoreceptors are shown in this image. Cones are colored green and rods are blue.
We have all experienced the different sensitivities of rods and cones when making the transition from a brightly lit environment to a dimly lit environment. Imagine going to see a blockbuster movie on a clear summer day. As you walk from the brightly lit lobby into the dark theater, you notice that you immediately have difficulty seeing much of anything. After a few minutes, you begin to adjust to the darkness and can see the interior of the theater. In the bright environment, your vision was dominated primarily by cone activity. As you move to the dark environment, rod activity dominates, but there is a delay in transitioning between the phases. If your rods do not transform light into nerve impulses as easily and efficiently as they should, you will have difficulty seeing in dim light, a condition known as night blindness.
Rods and cones are connected (via several interneurons) to retinal ganglion cells. Axons from the retinal ganglion cells converge and exit through the back of the eye to form the optic nerve. The optic nerve carries visual information from the retina to the brain. There is a point in the visual field called the blind spot: Even when light from a small object is focused on the blind spot, we do not see it. We are not consciously aware of our blind spots for two reasons: First, each eye gets a slightly different view of the visual field; therefore, the blind spots do not overlap. Second, our visual system fills in the blind spot so that although we cannot respond to visual information that occurs in that portion of the visual field, we are also not aware that information is missing.
Try It
The optic nerve from each eye merges just below the brain at a point called the optic chiasm. As Figure 3 shows, the optic chiasm is an X-shaped structure that sits just below the cerebral cortex at the front of the brain. At the point of the optic chiasm, information from the right visual field (which comes from both eyes) is sent to the left side of the brain, and information from the left visual field is sent to the right side of the brain.
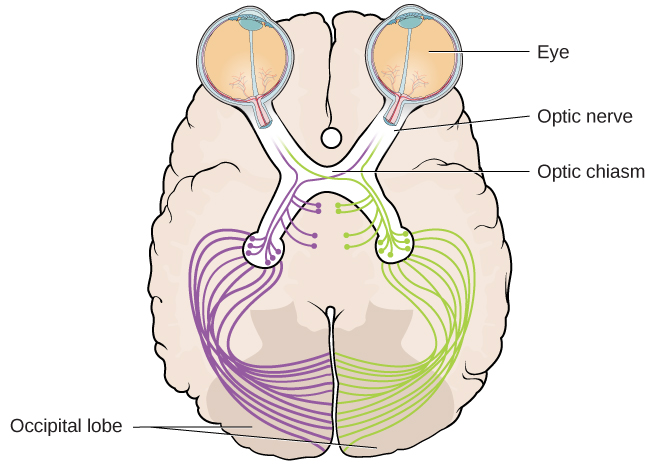
Figure 3. This illustration shows the optic chiasm at the front of the brain and the pathways to the occipital lobe at the back of the brain, where visual sensations are processed into meaningful perceptions.
Once inside the brain, visual information is sent via a number of structures to the occipital lobe at the back of the brain for processing. Visual information might be processed in parallel pathways which can generally be described as the “what pathway” (the ventral pathway) and the “where/how” pathway (the dorsal pathway). The “what pathway” is involved in object recognition and identification, while the “where/how pathway” is involved with location in space and how one might interact with a particular visual stimulus (Milner & Goodale, 2008; Ungerleider & Haxby, 1994). For example, when you see a ball rolling down the street, the “what pathway” identifies what the object is, and the “where/how pathway” identifies its location or movement in space.

Figure 4. Visual areas in the brain.
what do you think?
The Ethics of Research Using Animals
David Hubel and Torsten Wiesel were awarded the Nobel Prize in Medicine in 1981 for their research on the visual system. They collaborated for more than twenty years and made significant discoveries about the neurology of visual perception (Hubel & Wiesel, 1959, 1962, 1963, 1970; Wiesel & Hubel, 1963). They studied animals, mostly cats and monkeys. Although they used several techniques, they did considerable single-unit recordings, during which tiny electrodes were inserted in the animal’s brain to determine when a single cell was activated. Among their many discoveries, they found that specific brain cells respond to lines with specific orientations (called ocular dominance), and they mapped the way those cells are arranged in areas of the visual cortex known as columns and hypercolumns.
In some of their research, they sutured one eye of newborn kittens closed and followed the development of the kittens’ vision. They discovered there was a critical period of development for vision. If kittens were deprived of input from one eye, other areas of their visual cortex filled in the area that was normally used by the eye that was sewn closed. In other words, neural connections that exist at birth can be lost if they are deprived of sensory input.
What do you think about sewing a kitten’s eye closed for research? To many animal advocates, this would seem brutal, abusive, and unethical. What if you could do research that would help ensure babies and children born with certain conditions could develop normal vision instead of becoming blind? Would you want that research done? Would you conduct that research, even if it meant causing some harm to cats? Would you think the same way if you were the parent of such a child? What if you worked at the animal shelter?
Like virtually every other industrialized nation, the United States permits medical experimentation on animals, with few limitations (assuming sufficient scientific justification). The goal of any laws that exist is not to ban such tests but rather to limit unnecessary animal suffering by establishing standards for the humane treatment and housing of animals in laboratories.
As explained by Stephen Latham, the director of the Interdisciplinary Center for Bioethics at Yale (2012), possible legal and regulatory approaches to animal testing vary on a continuum from strong government regulation and monitoring of all experimentation at one end, to a self-regulated approach that depends on the ethics of the researchers at the other end. The United Kingdom has the most significant regulatory scheme, whereas Japan uses the self-regulation approach. The U.S. approach is somewhere in the middle, the result of a gradual blending of the two approaches.
There is no question that medical research is a valuable and important practice. The question is whether the use of animals is a necessary or even best practice for producing the most reliable results. Alternatives include the use of patient-drug databases, virtual drug trials, computer models and simulations, and noninvasive imaging techniques such as magnetic resonance imaging and computed tomography scans (“Animals in Science/Alternatives,” n.d.). Other techniques, such as microdosing, use humans not as test animals but as a means to improve the accuracy and reliability of test results. In vitro methods based on human cell and tissue cultures, stem cells, and genetic testing methods are also increasingly available.
Today, at the local level, any facility that uses animals and receives federal funding must have an Institutional Animal Care and Use Committee (IACUC) that ensures that the NIH guidelines are being followed. The IACUC must include researchers, administrators, a veterinarian, and at least one person with no ties to the institution: that is, a concerned citizen. This committee also performs inspections of laboratories and protocols.
Try It
Amplitude and Wavelength
As mentioned above, light enters your eyes as a wave. It is important to understand some basic properties of waves to see how they impact what we see. Two physical characteristics of a wave are amplitude and wavelength (Figure 5). The amplitude of a wave is the height of a wave as measured from the highest point on the wave (peak or crest) to the lowest point on the wave (trough). Wavelength refers to the length of a wave from one peak to the next.
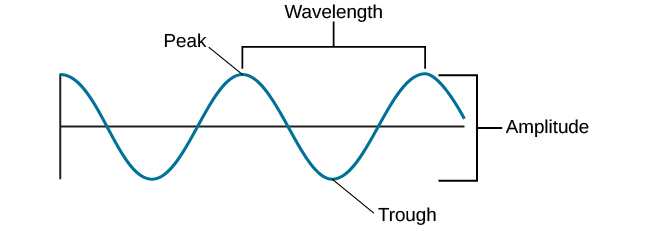
Figure 5. The amplitude or height of a wave is measured from the peak to the trough. The wavelength is measured from peak to peak.
Wavelength is directly related to the frequency of a given waveform. Frequency refers to the number of waves that pass a given point in a given time period and is often expressed in terms of hertz (Hz), or cycles per second. Longer wavelengths will have lower frequencies, and shorter wavelengths will have higher frequencies (Figure 6).
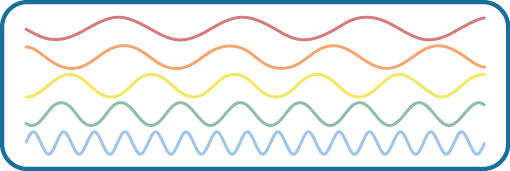
Figure 6. This figure illustrates waves of differing wavelengths/frequencies. At the top of the figure, the red wave has a long wavelength/short frequency. Moving from top to bottom, the wavelengths decrease and frequencies increase.
Light Waves
The visible spectrum is the portion of the larger electromagnetic spectrum that we can see. As Figure 7 shows, the electromagnetic spectrum encompasses all of the electromagnetic radiation that occurs in our environment and includes gamma rays, x-rays, ultraviolet light, visible light, infrared light, microwaves, and radio waves. The visible spectrum in humans is associated with wavelengths that range from 380 to 740 nm—a very small distance since a nanometer (nm) is one-billionth of a meter. Other species can detect other portions of the electromagnetic spectrum. For instance, honeybees can see light in the ultraviolet range (Wakakuwa, Stavenga, & Arikawa, 2007), and some snakes can detect infrared radiation in addition to more traditional visual light cues (Chen, Deng, Brauth, Ding, & Tang, 2012; Hartline, Kass, & Loop, 1978).
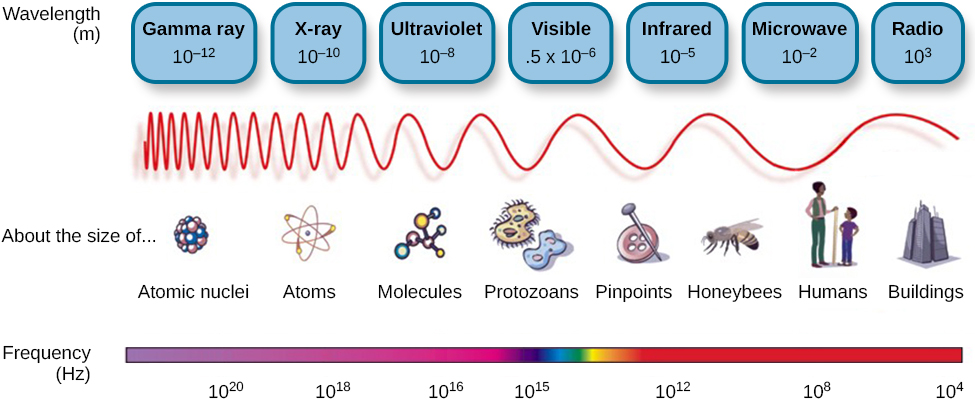
Figure 7. Light that is visible to humans makes up only a small portion of the electromagnetic spectrum.
In humans, light wavelength is associated with perception of color (Figure 8). Within the visible spectrum, our experience of red is associated with longer wavelengths, greens are intermediate, and blues and violets are shorter in wavelength. (An easy way to remember this is the mnemonic ROYGBIV: red, orange, yellow, green, blue, indigo, violet.) The amplitude of light waves is associated with our experience of brightness or intensity of color, with larger amplitudes appearing brighter.
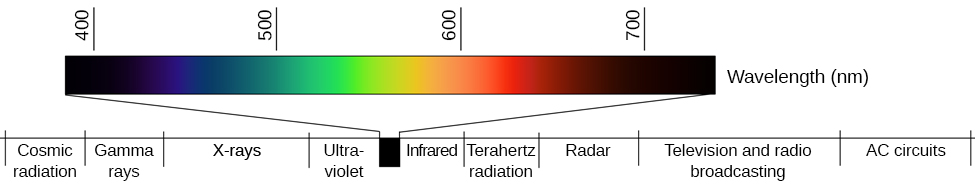
Figure 8. Different wavelengths of light are associated with our perception of different colors. (credit: modification of work by Johannes Ahlmann)
Try It
Glossary
Candela Citations
- Vision, Waves and Wavelengths. Authored by: OpenStax College. Located at: https://openstax.org/books/psychology-2e/pages/5-3-vision. License: CC BY: Attribution. License Terms: Download for free at https://openstax.org/books/psychology-2e/pages/1-introduction
- Vision, information on ventral and dorsal pathways. Authored by: Simona Buetti and Alejandro Lleras . Provided by: University of Illinois at Urbana-Champaign. Located at: http://nobaproject.com/modules/vision. License: CC BY-NC-SA: Attribution-NonCommercial-ShareAlike
- Waves and Wavelengths. Authored by: OpenStax College. Located at: http://cnx.org/contents/Sr8Ev5Og@5.52:1Cicp6CO@8/Waves-and-Wavelengths. License: CC BY: Attribution. License Terms: Download for free at http://cnx.org/contents/4abf04bf-93a0-45c3-9cbc-2cefd46e68cc@5.48