Learning Outcomes
- Verify a function using the vertical line test
- Verify a one-to-one function with the horizontal line test
- Identify the graphs of the toolkit functions
As we have seen in examples above, we can represent a function using a graph. Graphs display many input-output pairs in a small space. The visual information they provide often makes relationships easier to understand. We typically construct graphs with the input values along the horizontal axis and the output values along the vertical axis.
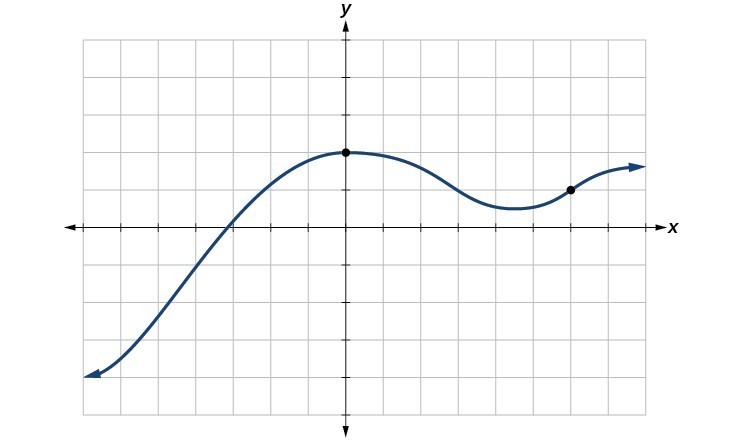
The most common graphs name the input value [latex]x[/latex] and the output value [latex]y[/latex], and we say [latex]y[/latex] is a function of [latex]x[/latex], or [latex]y=f\left(x\right)[/latex] when the function is named [latex]f[/latex]. The graph of the function is the set of all points [latex]\left(x,y\right)[/latex] in the plane that satisfies the equation [latex]y=f\left(x\right)[/latex]. If the function is defined for only a few input values, then the graph of the function is only a few points, where the x-coordinate of each point is an input value and the y-coordinate of each point is the corresponding output value. For example, the black dots on the graph in the graph below tell us that [latex]f\left(0\right)=2[/latex] and [latex]f\left(6\right)=1[/latex]. However, the set of all points [latex]\left(x,y\right)[/latex] satisfying [latex]y=f\left(x\right)[/latex] is a curve. The curve shown includes [latex]\left(0,2\right)[/latex] and [latex]\left(6,1\right)[/latex] because the curve passes through those points.
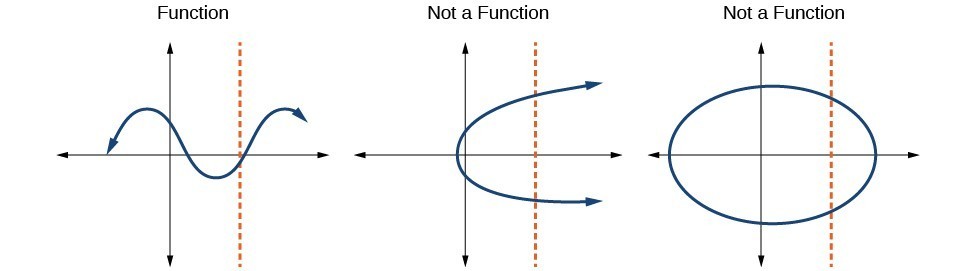
The vertical line test can be used to determine whether a graph represents a function. A vertical line includes all points with a particular [latex]x[/latex] value. The [latex]y[/latex] value of a point where a vertical line intersects a graph represents an output for that input [latex]x[/latex] value. If we can draw any vertical line that intersects a graph more than once, then the graph does not define a function because that [latex]x[/latex] value has more than one output. A function has only one output value for each input value.
How To: Given a graph, use the vertical line test to determine if the graph represents a function.
- Inspect the graph to see if any vertical line drawn would intersect the curve more than once.
- If there is any such line, the graph does not represent a function.
- If no vertical line can intersect the curve more than once, the graph does represent a function.
Example: Applying the Vertical Line Test
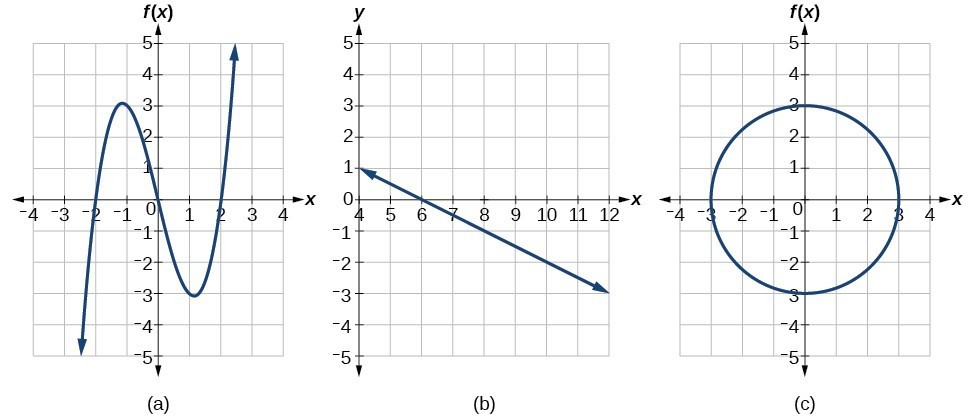
Which of the graphs represent(s) a function [latex]y=f\left(x\right)?[/latex]
Try It
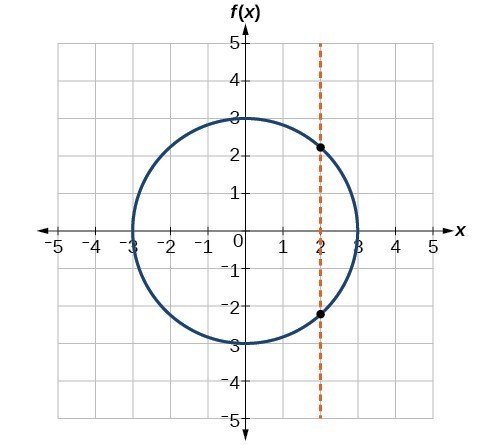
Does the graph below represent a function?
The Horizontal Line Test
Once we have determined that a graph defines a function, an easy way to determine if it is a one-to-one function is to use the horizontal line test. Draw horizontal lines through the graph. A horizontal line includes all points with a particular [latex]y[/latex] value. The [latex]x[/latex] value of a point where a vertical line intersects a function represents the input for that output [latex]y[/latex] value. If we can draw any horizontal line that intersects a graph more than once, then the graph does not represent a function because that [latex]y[/latex] value has more than one input.
How To: Given a graph of a function, use the horizontal line test to determine if the graph represents a one-to-one function.
- Inspect the graph to see if any horizontal line drawn would intersect the curve more than once.
- If there is any such line, the function is not one-to-one.
- If no horizontal line can intersect the curve more than once, the function is one-to-one.
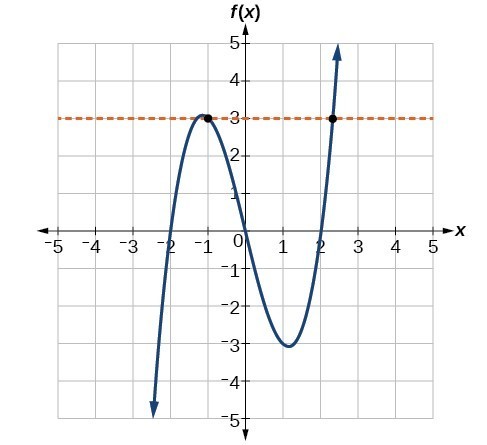
Example: Applying the Horizontal Line Test
Consider the functions (a), and (b)shown in the graphs below.
Are either of the functions one-to-one?
Identifying Basic Toolkit Functions
In this text we explore functions—the shapes of their graphs, their unique characteristics, their algebraic formulas, and how to solve problems with them. When learning to read, we start with the alphabet. When learning to do arithmetic, we start with numbers. When working with functions, it is similarly helpful to have a base set of building-block elements. We call these our “toolkit functions,” which form a set of basic named functions for which we know the graph, formula, and special properties. Some of these functions are programmed to individual buttons on many calculators. For these definitions we will use [latex]x[/latex] as the input variable and [latex]y=f\left(x\right)[/latex] as the output variable.
We will see these toolkit functions, combinations of toolkit functions, their graphs, and their transformations frequently throughout this book. It will be very helpful if we can recognize these toolkit functions and their features quickly by name, formula, graph, and basic table properties. The graphs and sample table values are included with each function shown below.
| Toolkit Functions | ||
|---|---|---|
| Name | Function | Graph |
| Constant | [latex]f\left(x\right)=c[/latex], where [latex]c[/latex] is a constant | 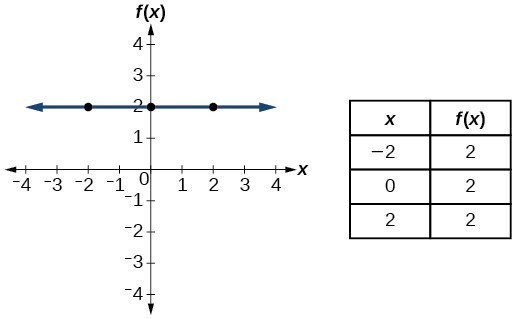 |
| Identity | [latex]f\left(x\right)=x[/latex] | 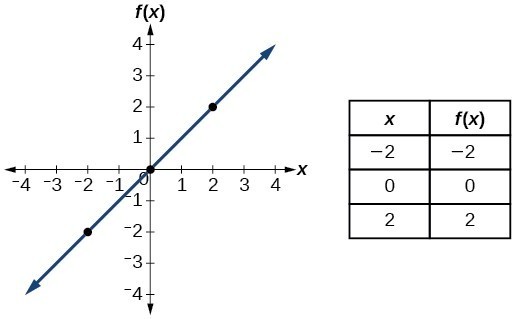 |
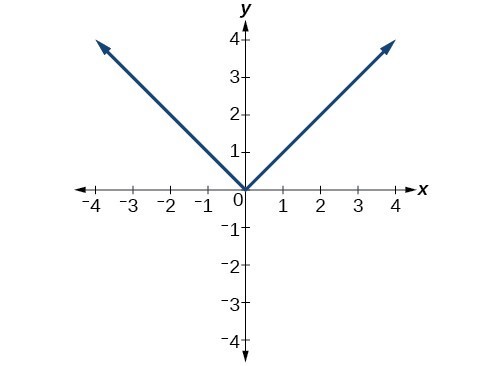
| Absolute value | [latex]f\left(x\right)=|x|[/latex] | 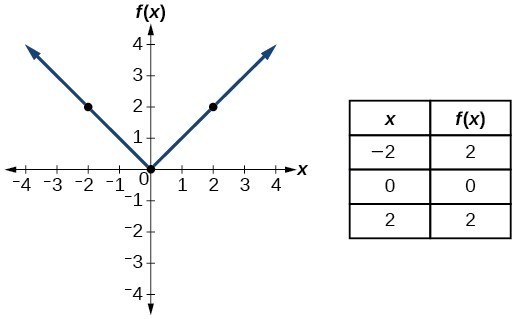 |
| Quadratic | [latex]f\left(x\right)={x}^{2}[/latex] | 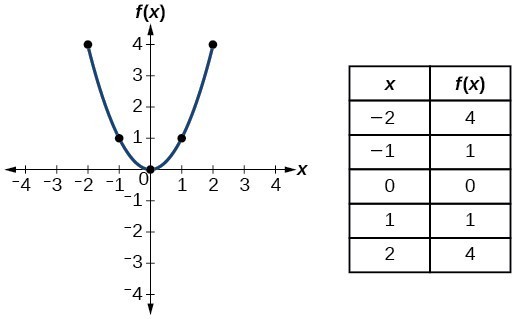 |
| Cubic | [latex]f\left(x\right)={x}^{3}[/latex] | 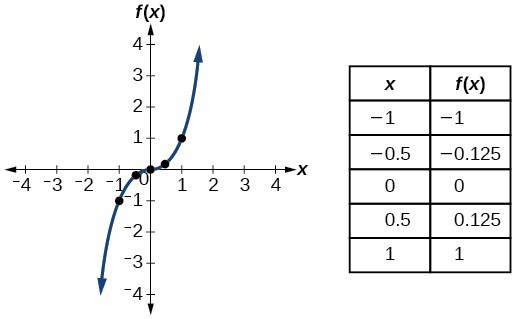 |
| Reciprocal/ Rational | [latex]f\left(x\right)=\frac{1}{x}[/latex] | 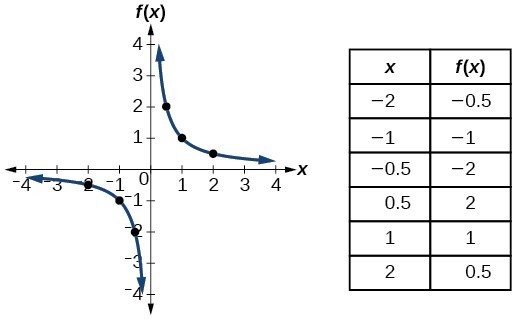 |
| Reciprocal / Rational squared | [latex]f\left(x\right)=\frac{1}{{x}^{2}}[/latex] | 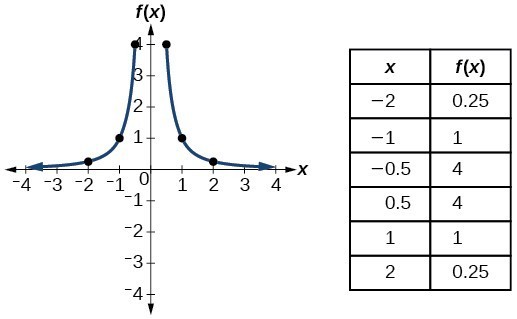 |
| Square root | [latex]f\left(x\right)=\sqrt{x}[/latex] | 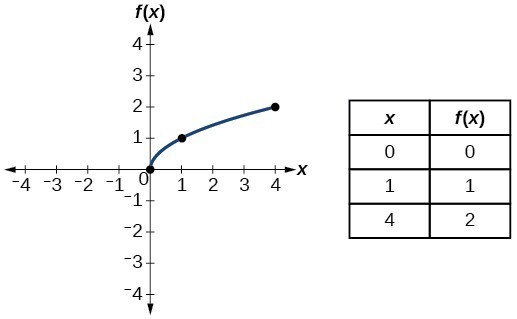 |
| Cube root | [latex]f\left(x\right)=\sqrt[3]{x}[/latex] | 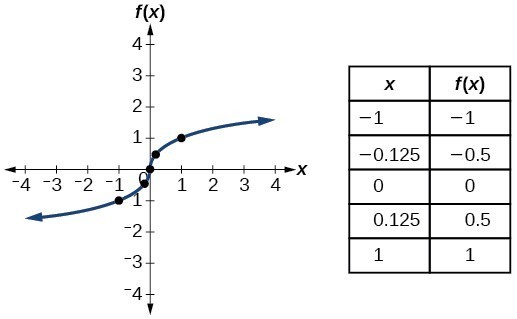 |
Try It
Try It
In this exercise, you will graph the toolkit functions using an online graphing tool.
- Graph each toolkit function using function notation.
- Make a table of values that references the function and includes at least the interval [-5,5].
Candela Citations
- Question ID 111715, 11722. Provided by: Lumen Learning. License: CC BY: Attribution. License Terms: IMathAS Community License CC-BY + GPL
- Revision and Adaptation. Provided by: Lumen Learning. License: CC BY: Attribution
- Vertical Line Test. Authored by: Lumen Learning. Located at: https://www.desmos.com/calculator/dcq8twow2q. License: CC BY: Attribution
- College Algebra. Authored by: Abramson, Jay et al.. Provided by: OpenStax. Located at: http://cnx.org/contents/9b08c294-057f-4201-9f48-5d6ad992740d@5.2. License: CC BY: Attribution. License Terms: Download for free at http://cnx.org/contents/9b08c294-057f-4201-9f48-5d6ad992740d@5.2
- Question ID 40676. Authored by: Jenck, Michael. License: CC BY: Attribution. License Terms: IMathAS Community License CC-BY + GPL