What you’ll learn to do: Construct probability models and compute probability to solve problems
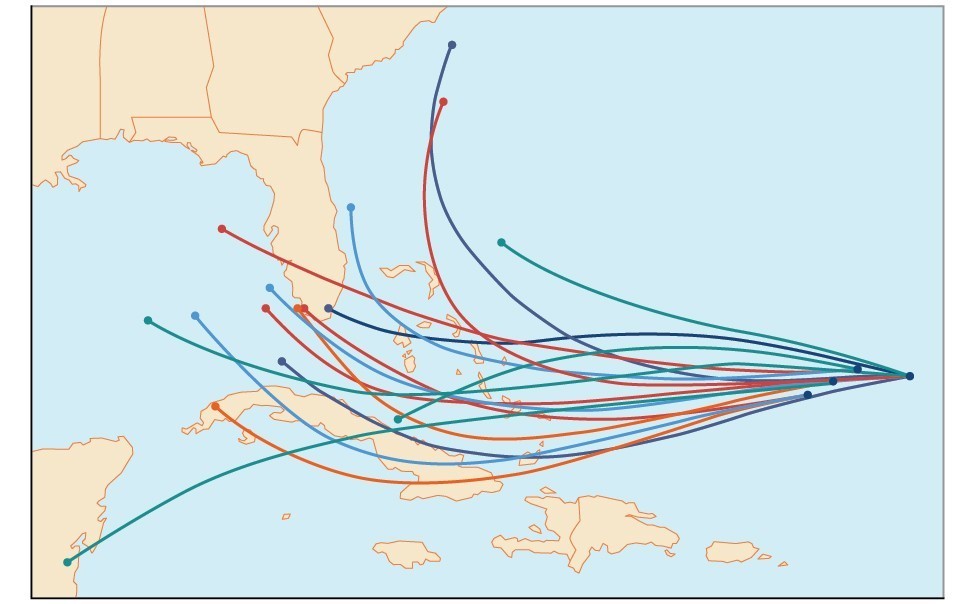
An example of a “spaghetti model,” which can be used to predict possible paths of a tropical storm.
Residents of the Southeastern United States are all too familiar with charts, known as spaghetti models, such as the one above.[1] They combine a collection of weather data to predict the most likely path of a hurricane. Each colored line represents one possible path. The group of squiggly lines can begin to resemble strands of spaghetti, hence the name. In this section, we will investigate methods for making these types of predictions.
Candela Citations
CC licensed content, Original
- Revision and Adaptation. Provided by: Lumen Learning. License: CC BY: Attribution
CC licensed content, Shared previously
- College Algebra. Authored by: Abramson, Jay et al.. Provided by: OpenStax. Located at: http://cnx.org/contents/9b08c294-057f-4201-9f48-5d6ad992740d@5.2. License: CC BY: Attribution. License Terms: Download for free at http://cnx.org/contents/9b08c294-057f-4201-9f48-5d6ad992740d@5.2
CC licensed content, Specific attribution
- Precalculus. Authored by: OpenStax College. Provided by: OpenStax. Located at: http://cnx.org/contents/fd53eae1-fa23-47c7-bb1b-972349835c3c@5.175:1/Preface. License: CC BY: Attribution
- The figure is for illustrative purposes only and does not model any particular storm. ↵