Learning Outcomes
- Graph Functions Using Compressions and Stretches.
Adding a constant to the inputs or outputs of a function changed the position of a graph with respect to the axes, but it did not affect the shape of a graph. We now explore the effects of multiplying the inputs or outputs by some quantity.
We can transform the inside (input values) of a function or we can transform the outside (output values) of a function. Each change has a specific effect that can be seen graphically.
Vertical Stretches and Compressions
When we multiply a function by a positive constant, we get a function whose graph is stretched or compressed vertically in relation to the graph of the original function. If the constant is greater than 1, we get a vertical stretch; if the constant is between 0 and 1, we get a vertical compression. The graph below shows a function multiplied by constant factors 2 and 0.5 and the resulting vertical stretch and compression.
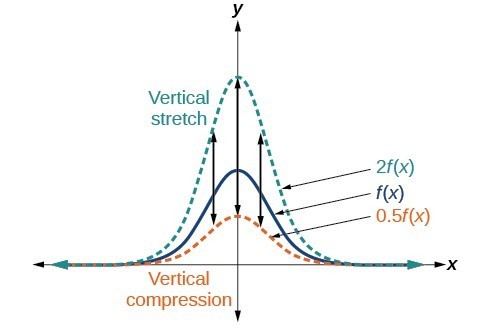
Vertical stretch and compression
A General Note: Vertical Stretches and Compressions
Given a function [latex]f\left(x\right)[/latex], a new function [latex]g\left(x\right)=af\left(x\right)[/latex], where [latex]a[/latex] is a constant, is a vertical stretch or vertical compression of the function [latex]f\left(x\right)[/latex].
- If [latex]a\gt 1[/latex], then the graph will be stretched.
- If [latex]0\lt a\lt 1[/latex], then the graph will be compressed.
- If [latex]a\lt 0[/latex], then there will be combination of a vertical stretch or compression with a vertical reflection.
How To: Given a function, graph its vertical stretch.
- Identify the value of [latex]a[/latex].
- Multiply all range values by [latex]a[/latex].
- If [latex]a>1[/latex], the graph is stretched by a factor of [latex]a[/latex].
If [latex]{ 0 }<{ a }<{ 1 }[/latex], the graph is compressed by a factor of [latex]a[/latex]. If [latex]a<0[/latex], the graph is either stretched or compressed and also reflected about the [latex]x[/latex]-axis.
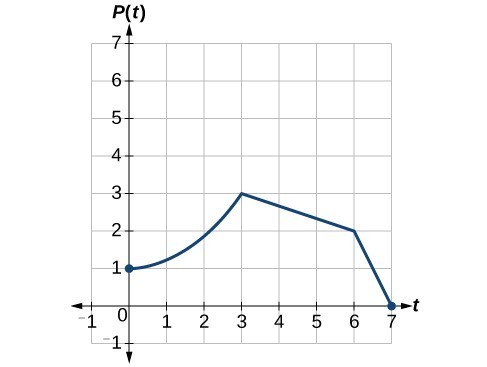
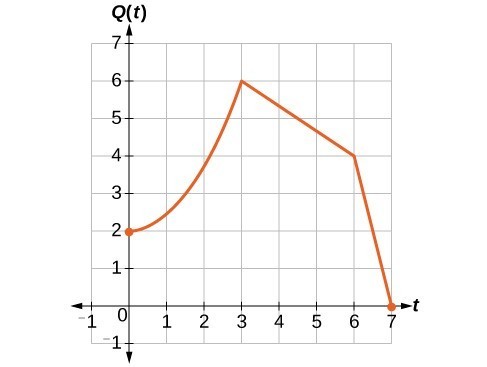
Example: Graphing a Vertical Stretch
A function [latex]P\left(t\right)[/latex] models the number of fruit flies in a population over time, and is graphed below.
A scientist is comparing this population to another population, [latex]Q[/latex], whose growth follows the same pattern, but is twice as large. Sketch a graph of this population.
Try It
How To: Given a tabular function and assuming that the transformation is a vertical stretch or compression, create a table for a vertical compression.
- Determine the value of [latex]a[/latex].
- Multiply all of the output values by [latex]a[/latex].
Example: Finding a Vertical Compression of a Tabular Function
A function [latex]f[/latex] is given in the table below. Create a table for the function [latex]g\left(x\right)=\frac{1}{2}f\left(x\right)[/latex].
| [latex]x[/latex] | 2 | 4 | 6 | 8 |
| [latex]f\left(x\right)[/latex] | 1 | 3 | 7 | 11 |
Try It
A function [latex]f[/latex] is given below. Create a table for the function [latex]g\left(x\right)=\frac{3}{4}f\left(x\right)[/latex].
| [latex]x[/latex] | 2 | 4 | 6 | 8 |
| [latex]f\left(x\right)[/latex] | 12 | 16 | 20 | 0 |
Example: Recognizing a Vertical Stretch
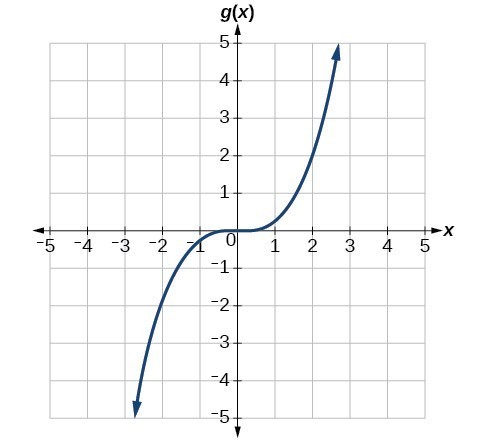
The graph is a transformation of the toolkit function [latex]f\left(x\right)={x}^{3}[/latex]. Relate this new function [latex]g\left(x\right)[/latex] to [latex]f\left(x\right)[/latex], and then find a formula for [latex]g\left(x\right)[/latex].
Try It
Write the formula for the function that we get when we vertically stretch (or scale) the identity toolkit function by a factor of 3, and then shift it down by 2 units.
Check your work with an online graphing calculator.

Horizontal Stretches and Compressions
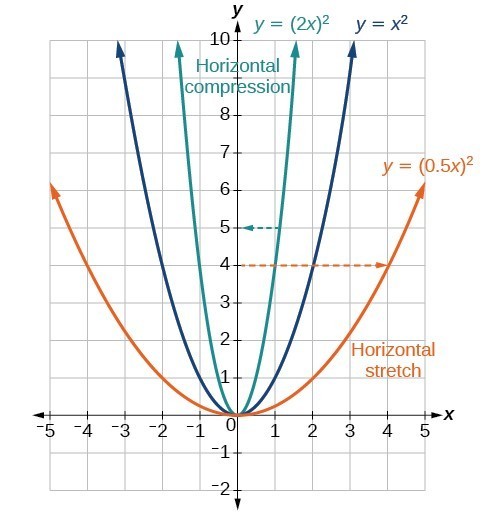
Now we consider changes to the inside of a function. When we multiply a function’s input by a positive constant, we get a function whose graph is stretched or compressed horizontally in relation to the graph of the original function. If the constant is between 0 and 1, we get a horizontal stretch; if the constant is greater than 1, we get a horizontal compression of the function.
Given a function [latex]y=f\left(x\right)[/latex], the form [latex]y=f\left(bx\right)[/latex] results in a horizontal stretch or compression. Consider the function [latex]y={x}^{2}[/latex]. The graph of [latex]y={\left(0.5x\right)}^{2}[/latex] is a horizontal stretch of the graph of the function [latex]y={x}^{2}[/latex] by a factor of 2. The graph of [latex]y={\left(2x\right)}^{2}[/latex] is a horizontal compression of the graph of the function [latex]y={x}^{2}[/latex] by a factor of 2.
A General Note: Horizontal Stretches and Compressions
Given a function [latex]f\left(x\right)[/latex], a new function [latex]g\left(x\right)=f\left(bx\right)[/latex], where [latex]b[/latex] is a constant, is a horizontal stretch or horizontal compression of the function [latex]f\left(x\right)[/latex].
- If [latex]b\gt 1[/latex], then the graph will be compressed by [latex]\frac{1}{b}[/latex].
- If [latex]0\lt b\lt 1[/latex], then the graph will be stretched by [latex]\frac{1}{b}[/latex].
- If [latex]b\lt 0[/latex], then there will be combination of a horizontal stretch or compression with a horizontal reflection.
How To: Given a description of a function, sketch a horizontal compression or stretch.
- Write a formula to represent the function.
- Set [latex]g\left(x\right)=f\left(bx\right)[/latex] where [latex]b\gt 1[/latex] for a compression or [latex]0\lt b\lt 1[/latex]
for a stretch.
Example: Graphing a Horizontal Compression
Suppose a scientist is comparing a population of fruit flies to a population that progresses through its lifespan twice as fast as the original population. In other words, this new population, [latex]R[/latex], will progress in 1 hour the same amount as the original population does in 2 hours, and in 2 hours, it will progress as much as the original population does in 4 hours. Sketch a graph of this population.
![Two side-by-side graphs. The first graph has function for original population whose domain is [0,7] and range is [0,3]. The maximum value occurs at (3,3). The second graph has the same shape as the first except it is half as wide. It is a graph of transformed population, with a domain of [0, 3.5] and a range of [0,3]. The maximum occurs at (1.5, 3).](https://s3-us-west-2.amazonaws.com/courses-images/wp-content/uploads/sites/896/2016/10/18203623/CNX_Precalc_Figure_01_05_029ab.jpg)
Example: Finding a Horizontal Stretch for a Tabular Function
A function [latex]f\left(x\right)[/latex] is given below. Create a table for the function [latex]g\left(x\right)=f\left(\frac{1}{2}x\right)[/latex].
| [latex]x[/latex] | 2 | 4 | 6 | 8 |
| [latex]f\left(x\right)[/latex] | 1 | 3 | 7 | 11 |

Example: Recognizing a Horizontal Compression on a Graph
Relate the function [latex]g\left(x\right)[/latex] to [latex]f\left(x\right)[/latex].
Try It
Write a formula for the toolkit square root function horizontally stretched by a factor of 3.
Use an online graphing calculator to check your work.

Candela Citations
- Revision and Adaptation. Provided by: Lumen Learning. License: CC BY: Attribution
- Question ID 112707, 112726. Authored by: Lumen Learning. License: CC BY: Attribution. License Terms: IMathAS Community License CC-BY + GPL
- College Algebra. Authored by: Abramson, Jay et al.. Provided by: OpenStax. Located at: http://cnx.org/contents/9b08c294-057f-4201-9f48-5d6ad992740d@5.2. License: CC BY: Attribution. License Terms: Download for free at http://cnx.org/contents/9b08c294-057f-4201-9f48-5d6ad992740d@5.2
- Question ID 74696. Authored by: Meacham,William. License: CC BY: Attribution. License Terms: IMathAS Community License CC-BY + GPL
- Question ID 60791, 60790. Authored by: Day, Alyson. License: CC BY: Attribution. License Terms: IMathAS Community License CC-BY + GPL