Learning Outcomes
- Graph a non linear inequality.
- Graph a system of nonlinear inequalities.
All of the equations in the systems that we have encountered so far have involved equalities, but we may also encounter systems that involve inequalities. We have already learned to graph linear inequalities by graphing the corresponding equation, and then shading the region represented by the inequality symbol. As a reminder, here is one to try. Choose the type of line first, then graph it, and click on the side that satisfies the inequality.
try it
Now we will follow similar steps to graph a nonlinear inequality so that we can learn to solve systems of nonlinear inequalities. A nonlinear inequality is an inequality containing a nonlinear expression. Graphing a nonlinear inequality is much like graphing a linear inequality.
recall graphing nonlinear equations
Nonlinear equations may be any type of equation you have studied so far than is not the equation of a line. They may be parabolas, as in the examples below, or any of the curves you’ve studied.
Feel free to return to earlier sections on functions to recall how to graph them by plotting points or by transforming the parent function.
Recall that when the inequality is strictly greater than, [latex]y\gt a[/latex], or less than, [latex]y\lt a,\text{}[/latex] the graph is drawn with a dashed line. When the inequality is greater than or equal to, [latex]y\ge a,\text{}[/latex] or less than or equal to, [latex]y\le a,\text{}[/latex] the graph is drawn with a solid line. The graphs will create regions in the plane, and we will test each region for a solution. If one point in the region works, the whole region works. That is the region we shade.
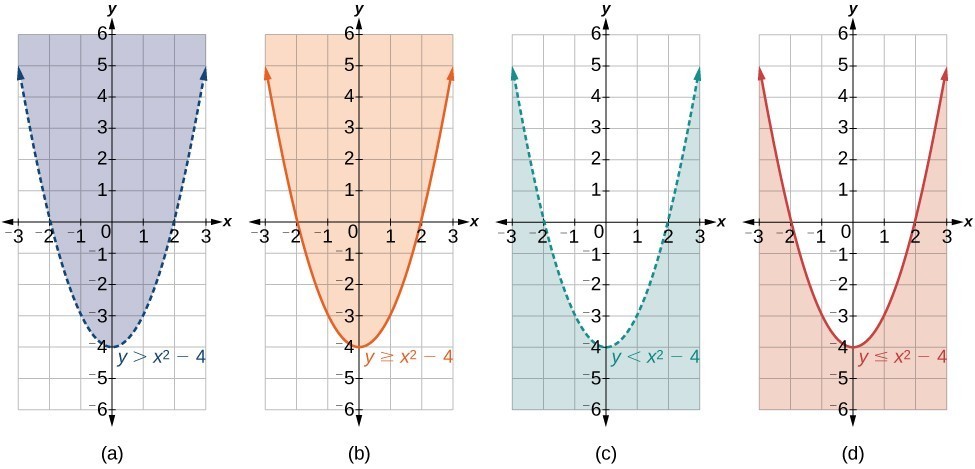
(a) an example of [latex]y>a[/latex]; (b) an example of [latex]y\ge a[/latex]; (c) an example of [latex]y<a[/latex]; (d) an example of [latex]y\le a[/latex]
How To: Given an inequality bounded by a parabola, sketch a graph.
- Graph the parabola as if it were an equation. This is the boundary for the region that is the solution set.
- If the boundary is included in the region (the operator is [latex]\le[/latex] or [latex]\ge[/latex] ), the parabola is graphed as a solid line.
- If the boundary is not included in the region (the operator is < or >), the parabola is graphed as a dashed line.
- Test a point in one of the regions to determine whether it satisfies the inequality statement. If the statement is true, the solution set is the region including the point. If the statement is false, the solution set is the region on the other side of the boundary line.
- Shade the region representing the solution set.
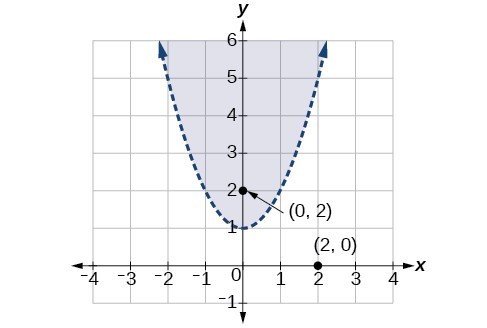
Example: Graphing an Inequality for a Parabola
Graph the inequality [latex]y>{x}^{2}+1[/latex].
Try it
Graphing a System of Nonlinear Inequalities
Now that we have learned to graph nonlinear inequalities, we can learn how to graph systems of nonlinear inequalities. A system of nonlinear inequalities is a system of two or more inequalities in two or more variables containing at least one inequality that is not linear. Graphing a system of nonlinear inequalities is similar to graphing a system of linear inequalities. The difference is that our graph may result in more shaded regions that represent a solution than we find in a system of linear inequalities. The solution to a nonlinear system of inequalities is the region of the graph where the shaded regions of the graph of each inequality overlap, or where the regions intersect, called the feasible region.
How To: Given a system of nonlinear inequalities, sketch a graph.
- Find the intersection points by solving the corresponding system of nonlinear equations.
- Graph the nonlinear equations.
- Find the shaded regions of each inequality.
- Identify the feasible region as the intersection of the shaded regions of each inequality or the set of points common to each inequality.
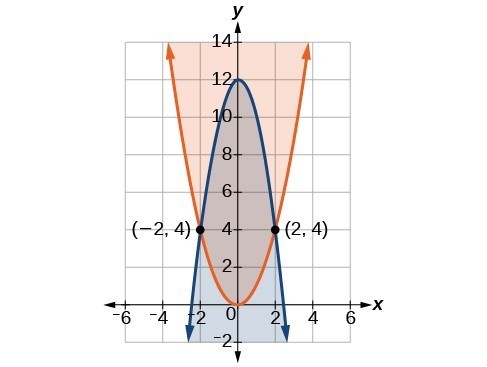
Example: Graphing a System of Inequalities
Graph the given system of inequalities.
[latex]\begin{gathered} {x}^{2}-y\le 0\\ 2{x}^{2}+y\le 12\end{gathered}[/latex]
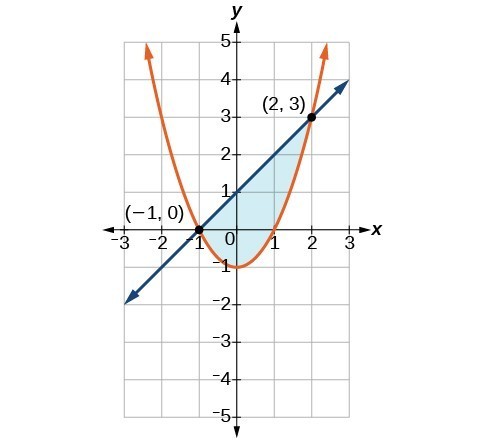
Try It
Graph the given system of inequalities.
[latex]\begin{gathered}y\ge {x}^{2}-1 \\ x-y\ge -1 \end{gathered}[/latex]
Candela Citations
- Revision and Adaptation. Provided by: Lumen Learning. License: CC BY: Attribution
- College Algebra. Authored by: Abramson, Jay et al.. Provided by: OpenStax. Located at: http://cnx.org/contents/9b08c294-057f-4201-9f48-5d6ad992740d@5.2. License: CC BY: Attribution. License Terms: Download for free at http://cnx.org/contents/9b08c294-057f-4201-9f48-5d6ad992740d@5.2
- Question ID 127575. Authored by: Day, Alyson. License: CC BY: Attribution. License Terms: IMathAS Community License CC-BY + GPL
- Question ID 70349. Authored by: Shahbazian,Roy. License: CC BY: Attribution. License Terms: IMathAS Community License CC-BY + GPL
- Question ID 19940. Authored by: Georgiakaki,Sophia. License: CC BY: Attribution. License Terms: IMathAS Community License CC-BY + GPL
- Precalculus. Authored by: OpenStax College. Provided by: OpenStax. Located at: http://cnx.org/contents/fd53eae1-fa23-47c7-bb1b-972349835c3c@5.175:1/Preface. License: CC BY: Attribution