Now that you have become familiar with the rectangular coordinate system, you are ready to consider the problem posed at the beginning of the module:
Caroline wants to take a spring break trip that will cost approximately $2,500.
- How many hours will she have to work to earn enough to pay for her vacation?
- If she can only work 4 hours per day, how many days per week will she have to work?
- How many weeks will it take?
The amount Caroline has at any given time depends on the number of hours she works. If you write an equation that models the amount of money in her account at a given time, you will be able to answer the questions posed above. Begin by recalling what you know:
- Caroline has a job that pays $15.00/hr
- She is starting with an initial deposit in her savings account of $400.
Next, choose a variable to represent the number of hours, such as [latex]h[/latex]. Her savings account balance is equal to the amount Caroline earns from working plus the initial deposit.
You can calculate the total amount Caroline gets paid by multiplying the amount per hour by the number of hours, [latex]15h[/latex]. Now you can write your equation:
Savings account balance = amount earned from working + initial deposit
Savings account balance = [latex]15h+400[/latex]
Now that you have an equation, you can determine how many hours Caroline needs to work to earn $2500
Savings account balance =[latex]15h+400[/latex]
[latex]2500=15h+400[/latex]
[latex]2100=15h[/latex]
[latex]140=h[/latex]
So Caroline needs to work 140 hours to have enough money for her trip. Okay, we are making progress now.
The next question asked you to determine how many days per week Caroline would have to work if she can work only 4 hours per day. How can you find the number of days if you know the total number of hours and the number of hours per day? Divide!
[latex]\frac{140}{4}=35[/latex]
Caroline will have to work 35 days to reach her goal. Since there are 7 days in a week, she will need to work 5 weeks, assuming she works every day.
Now you have answered all the questions, but you can enhance your solution by considering the second way to look at this problem—creating and analyzing a graph. You were provided a graph at the beginning of the module, but now you can create the graph for yourself. Go back to the equation you wrote to represent the problem.
Savings account balance = [latex]15h+400[/latex]
You can set the savings account balance as [latex]y[/latex] and the number of hours as [latex]x[/latex].
[latex]y=15x+400[/latex]
Then you can create a table of points using the equation.
| [latex]x[/latex] | [latex]y=15x+400[/latex] | [latex]y[/latex] | [latex](x, y)[/latex] |
| 0 | [latex]y=15\left(0\right)+400[/latex] | 400 | (0, 400) |
| 10 | [latex]y=15\left(10\right)+400[/latex] | 550 | (10, 550) |
| 20 | [latex]y=15\left(20\right)+400[/latex] | 700 | (20, 700) |
| 30 | [latex]y=15\left(30\right)+400[/latex] | 850 | (30, 850) |
Plot the points in the table and then connect them. Congratulations, you created the graph you saw at the beginning of the module!
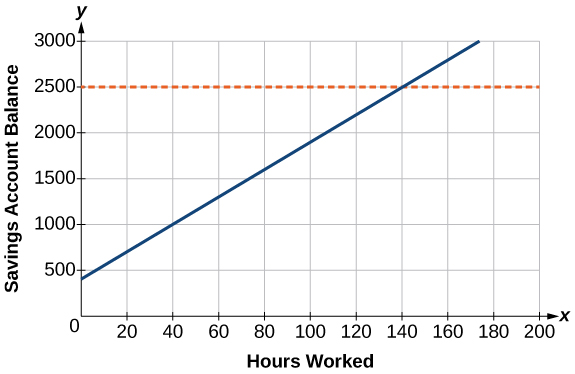
The slope, or slant, of the line is determined by the equation.
[latex]y=mx+b[/latex]
[latex]y=15x+400[/latex]
So the slope is 15 and depends on the amount Caroline earns per hour. How do you think the graph would change if she were paid a different rate? If she were paid less, the line would be less steep and if she were paid more, the line would be steeper. Both would affect how long it would take her to reach her goal as indicated by the orange line.
The orange horizontal line is the line [latex]y=2500[/latex] because that is the amount Caroline needs for her trip. How can you tell the number of hours she needs to work just by looking at the graph? The point at which the two lines intersect gives the answer. So find that point on the graph and then trace down to the x-axis. You wind up at 140 hours which is exactly what you calculated earlier.
Another nice feature of the graph is that you can see how much Caroline has after any number of hours worked and how many hours she has left to go. For example, suppose Caroline has worked 40 hours. How much savings does she have? To figure it out, find 40 hours on the x-axis and then trace vertically up to the line. Read left to the y-axis to find that she has $1000 dollars. Every point on the graph relates a number of hours worked to the amount in her savings account. So the point you just looked at, (40, 1000), relates 40 hours to $1000. The point Caroline needs to get to, (140, 2500) relates 140 hours of work to her goal of $2,500. Now there is only one thing left to do. Caroline needs to get to work so she can enjoy her spring break vacation!
Candela Citations
- Revision and Adaptation. Authored by: Lumen Learning. License: CC BY: Attribution
- College Algebra. Authored by: OpenStax College Algebra. License: CC BY: Attribution. License Terms: Download for free at http://cnx.org/contents/9b08c294-057f-4201-9f48-5d6ad992740d@5.2