Learning Outcomes
- Graph functions using vertical and horizontal shifts.
One kind of transformation involves shifting the entire graph of a function up, down, right, or left. The simplest shift is a vertical shift, moving the graph up or down, because this transformation involves adding a positive or negative constant to the function. In other words, we add the same constant to the output value of the function regardless of the input. For a function [latex]g\left(x\right)=f\left(x\right)+k[/latex], the function [latex]f\left(x\right)[/latex] is shifted vertically [latex]k[/latex] units.
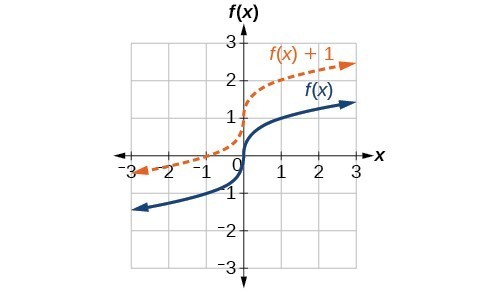
Vertical shift by [latex]k=1[/latex] of the cube root function [latex]f\left(x\right)=\sqrt[3]{x}[/latex].
To help you visualize the concept of a vertical shift, consider that [latex]y=f\left(x\right)[/latex]. Therefore, [latex]f\left(x\right)+k[/latex] is equivalent to [latex]y+k[/latex]. Every unit of [latex]y[/latex] is replaced by [latex]y+k[/latex], so the [latex]y\text{-}[/latex] value increases or decreases depending on the value of [latex]k[/latex]. The result is a shift upward or downward.
A General Note: Vertical Shift
Given a function [latex]f\left(x\right)[/latex], a new function [latex]g\left(x\right)=f\left(x\right)+k[/latex], where [latex]k[/latex] is a constant, is a vertical shift of the function [latex]f\left(x\right)[/latex]. All the output values change by [latex]k[/latex] units. If [latex]k[/latex] is positive, the graph will shift up. If [latex]k[/latex] is negative, the graph will shift down.
Example: Adding a Constant to a Function
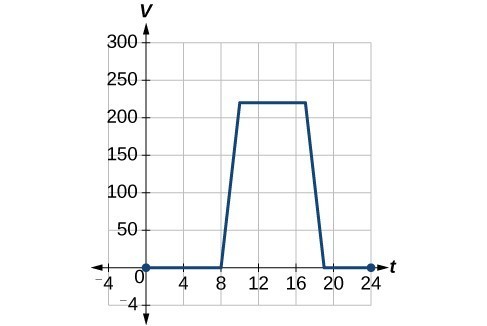
To regulate temperature in a green building, airflow vents near the roof open and close throughout the day. Figure 2 shows the area of open vents [latex]V[/latex] (in square feet) throughout the day in hours after midnight, [latex]t[/latex]. During the summer, the facilities manager decides to try to better regulate temperature by increasing the amount of open vents by 20 square feet throughout the day and night. Sketch a graph of this new function.

How To: Given a tabular function, create a new row to represent a vertical shift.
- Identify the output row or column.
- Determine the magnitude of the shift.
- Add the shift to the value in each output cell. Add a positive value for up or a negative value for down.
Example: Shifting a Tabular Function Vertically
A function [latex]f\left(x\right)[/latex] is given below. Create a table for the function [latex]g\left(x\right)=f\left(x\right)-3[/latex].
| [latex]x[/latex] | 2 | 4 | 6 | 8 |
| [latex]f\left(x\right)[/latex] | 1 | 3 | 7 | 11 |
Try It
The function [latex]h\left(t\right)=-4.9{t}^{2}+30t[/latex] gives the height [latex]h[/latex] of a ball (in meters) thrown upward from the ground after [latex]t[/latex] seconds. Suppose the ball was instead thrown from the top of a 10-m building. Relate this new height function [latex]b\left(t\right)[/latex] to [latex]h\left(t\right)[/latex], and then find a formula for [latex]b\left(t\right)[/latex].
Identifying Horizontal Shifts
We just saw that the vertical shift is a change to the output, or outside, of the function. We will now look at how changes to input, on the inside of the function, change its graph and meaning. A shift to the input results in a movement of the graph of the function left or right in what is known as a horizontal shift.
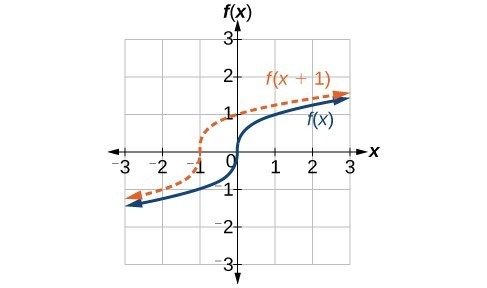
Horizontal shift of the function [latex]f\left(x\right)=\sqrt[3]{x}[/latex]. Note that [latex]h=+1[/latex] shifts the graph to the left, that is, towards negative values of [latex]x[/latex].
For example, if [latex]f\left(x\right)={x}^{2}[/latex], then [latex]g\left(x\right)={\left(x - 2\right)}^{2}[/latex] is a new function. Each input is reduced by 2 prior to squaring the function. The result is that the graph is shifted 2 units to the right, because we would need to increase the prior input by 2 units to yield the same output value as given in [latex]f[/latex].
A General Note: Horizontal Shift
Given a function [latex]f[/latex], a new function [latex]g\left(x\right)=f\left(x-h\right)[/latex], where [latex]h[/latex] is a constant, is a horizontal shift of the function [latex]f[/latex]. If [latex]h[/latex] is positive, the graph will shift right. If [latex]h[/latex] is negative, the graph will shift left.
Example: Adding a Constant to an Input
Returning to our building airflow example from Example 2, suppose that in autumn the facilities manager decides that the original venting plan starts too late, and wants to begin the entire venting program 2 hours earlier. Sketch a graph of the new function.

How To: Given a tabular function, create a new row to represent a horizontal shift.
- Identify the input row or column.
- Determine the magnitude of the shift.
- Add the shift to the value in each input cell.
Example: Shifting a Tabular Function Horizontally
A function [latex]f\left(x\right)[/latex] is given below. Create a table for the function [latex]g\left(x\right)=f\left(x - 3\right)[/latex].
| [latex]x[/latex] | 2 | 4 | 6 | 8 |
| [latex]f\left(x\right)[/latex] | 1 | 3 | 7 | 11 |

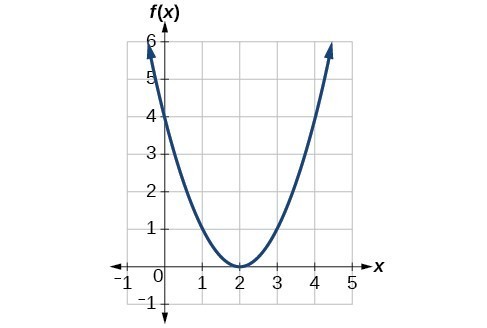
Example: Identifying a Horizontal Shift of a Toolkit Function
This graph represents a transformation of the toolkit function [latex]f\left(x\right)={x}^{2}[/latex]. Relate this new function [latex]g\left(x\right)[/latex] to [latex]f\left(x\right)[/latex], and then find a formula for [latex]g\left(x\right)[/latex].
Example: Interpreting Horizontal versus Vertical Shifts
The function [latex]G\left(m\right)[/latex] gives the number of gallons of gas required to drive [latex]m[/latex] miles. Interpret [latex]G\left(m\right)+10[/latex] and [latex]G\left(m+10\right)[/latex].
Try It
Given the function [latex]f\left(x\right)=\sqrt{x}[/latex], graph the original function [latex]f\left(x\right)[/latex] and the transformation [latex]g\left(x\right)=f\left(x+2\right)[/latex] on the same axes. Is this a horizontal or a vertical shift? Which way is the graph shifted and by how many units?
Try It
Online graphing calculators can graph transformations using function notation. Use an online graphing calculator to graph the toolkit function [latex]f(x) = x^2[/latex]
Now, enter [latex]f(x+5)[/latex], and [latex]f(x)+5[/latex] in the next two lines.
Now have the online graphing calculator make a table of values for the original function. Include integer values on the interval [latex][-5,5][/latex]. Replace the column labeled [latex]y_{1}[/latex] with [latex]f(x_{1})[/latex].
Now replace [latex]f(x_{1})[/latex] with [latex]f(x_{1}+3)[/latex], and [latex]f(x_{1})+3[/latex].
What are the corresponding functions associated with the transformations you have graphed?
Candela Citations
- Revision and Adaptation. Provided by: Lumen Learning. License: CC BY: Attribution
- Question ID 113437, 60789. Authored by: Lumen Learning. License: CC BY: Attribution. License Terms: IMathAS Community License CC-BY + GPL
- College Algebra. Authored by: Abramson, Jay et al.. Provided by: OpenStax. Located at: http://cnx.org/contents/9b08c294-057f-4201-9f48-5d6ad992740d@5.2. License: CC BY: Attribution. License Terms: Download for free at http://cnx.org/contents/9b08c294-057f-4201-9f48-5d6ad992740d@5.2
- Question ID 75586, 75929, 75931. Authored by: Shahbazian, Roy. License: CC BY: Attribution. License Terms: IMathAS Community License CC-BY + GPL
- Question ID 33066. Authored by: Smart, Jim. License: CC BY: Attribution. License Terms: IMathAS Community License CC-BY + GPL