Learning Outcomes
- Graph vertical and horizontal shifts of quadratic functions
- Graph vertical compressions and stretches of quadratic functions
- Write the equation of a transformed quadratic function using the vertex form
- Identify the vertex and axis of symmetry for a given quadratic function in vertex form
The standard form of a quadratic function presents the function in the form
[latex]f\left(x\right)=a{\left(x-h\right)}^{2}+k[/latex]
where [latex]\left(h,\text{ }k\right)[/latex] is the vertex. Because the vertex appears in the standard form of the quadratic function, this form is also known as the vertex form of a quadratic function.
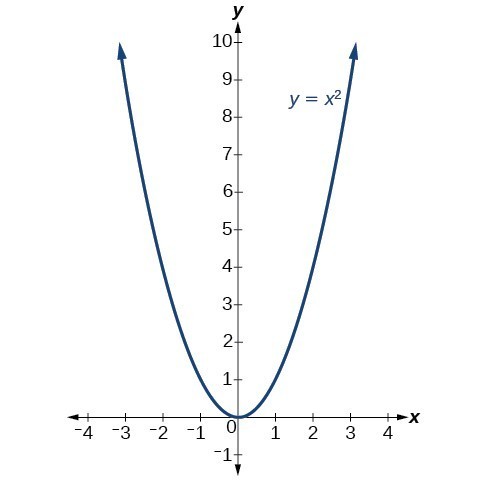
The standard form is useful for determining how the graph is transformed from the graph of [latex]y={x}^{2}[/latex]. The figure below is the graph of this basic function.
Shift Up and Down by Changing the Value of [latex]k[/latex]
You can represent a vertical (up, down) shift of the graph of [latex]f(x)=x^2[/latex] by adding or subtracting a constant, [latex]k[/latex].
[latex]f(x)=x^2 + k[/latex]
If [latex]k>0[/latex], the graph shifts upward, whereas if [latex]k<0[/latex], the graph shifts downward.
Example
Using an online graphing calculator, plot the function [latex]f(x)=x^2+k[/latex]. Now change the [latex]k[/latex] value to shift the graph down 4 units, then up 4 units.
Shift left and right by changing the value of [latex]h[/latex]
You can represent a horizontal (left, right) shift of the graph of [latex]f(x)=x^2[/latex] by adding or subtracting a constant, [latex]h[/latex], to the variable [latex]x[/latex], before squaring.
[latex]f(x)=(x-h)^2[/latex]
If [latex]h>0[/latex], the graph shifts toward the right and if [latex]h<0[/latex], the graph shifts to the left.
tip for success
Remember that the negative sign inside the argument of the vertex form of a parabola (in the parentheses with the variable [latex]x[/latex] ) is part of the formula [latex]f(x)=(x-h)^2 +k[/latex].
If [latex]h>0[/latex], we have [latex]f(x)=(x-h)^2 +k[/latex]. You’ll see the negative sign, but the graph will shift right.
If [latex]h<0[/latex], we have [latex]f(x)=(x-(-h))^2 +k \rightarrow f(x)=(x+h)^2+k[/latex]. You’ll see the positive sign, but the graph will shift left.
Example
Using an online graphing calculator, plot the function [latex]f(x)=(x-h)^2[/latex]. Now change the [latex]h[/latex] value to shift the graph 2 units to the right, then 2 units to the left.
Stretch or compress by changing the value of [latex]a[/latex].
You can represent a stretch or compression (narrowing, widening) of the graph of [latex]f(x)=x^2[/latex] by multiplying the squared variable by a constant, [latex]a[/latex].
[latex]f(x)=ax^2[/latex]
The magnitude of [latex]a[/latex] indicates the stretch of the graph. If [latex]|a|>1[/latex], the point associated with a particular [latex]x[/latex]-value shifts farther from the [latex]x[/latex]–axis, so the graph appears to become narrower, and there is a vertical stretch. But if [latex]|a|<1[/latex], the point associated with a particular [latex]x[/latex]-value shifts closer to the [latex]x[/latex]–axis, so the graph appears to become wider, but in fact there is a vertical compression.
Example
Using an online graphing calculator plot the function [latex]f(x)=ax^2[/latex]. Now adjust the [latex]a[/latex] value to create a graph that has been compressed vertically by a factor of [latex]\frac{1}{2}[/latex] and another that has been vertically stretched by a factor of 3. What are the equations of the two graphs?
The standard form and the general form are equivalent methods of describing the same function. We can see this by expanding out the general form and setting it equal to the standard form.
This is the [latex]x[/latex] coordinate of the vertexr and [latex]x=-\dfrac{b}{2a}[/latex] is the axis of symmetry we defined earlier. Setting the constant terms equal gives us:
In practice, though, it is usually easier to remember that [latex]h[/latex] is the output value of the function when the input is [latex]h[/latex], so [latex]f\left(h\right)=f\left(-\dfrac{b}{2a}\right)=k[/latex].
Example
Using an online graphing calculator plot the function [latex]f\left(x\right)\ =\ a\left(x-h\right)^2+k[/latex]. Now adjust the variables [latex]a,h,k[/latex] to define two quadratic functions whose axis of symmetry is [latex]x=-3[/latex], and whose vertex is [latex](-3, 2)[/latex].
How many potential values are there for [latex]h[/latex] in this scenario? How about [latex]k[/latex]? How about [latex]a[/latex]
Challenge Problem
Define a function whose axis of symmetry is [latex]x = -3[/latex], and whose vertex is [latex](-3,2)[/latex] and has an average rate of change of 2 on the interval [latex][-2,0][/latex].
Use the online graphing calculator where you plotted [latex]f\left(x\right)\ =\ a\left(x-h\right)^2+k[/latex] to help with this.
Try It
A coordinate grid has been superimposed over the quadratic path of a basketball in the picture below. Find an equation for the path of the ball. Does the shooter make the basket?
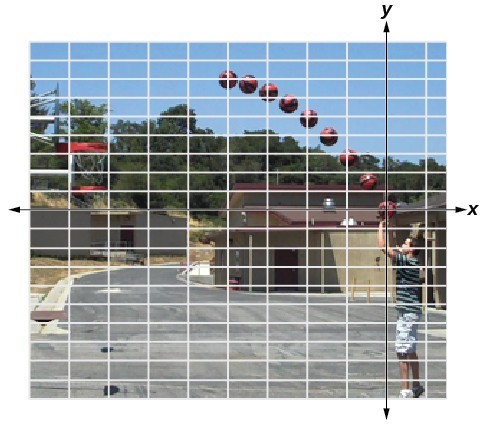
(credit: modification of work by Dan Meyer)
Candela Citations
- Interactive: Transform Quadratic 1. Provided by: Lumen Learning (with Desmos). Located at: https://www.desmos.com/calculator/fpatj6tbcn. License: CC BY: Attribution
- Interactive: Transform Quadratic 2. Provided by: Lumen Learning (with Desmos). Located at: https://www.desmos.com/calculator/5g3xfhkklq. License: CC BY: Attribution
- Interactive: Transform Quadratic 3. Provided by: Lumen Learning (with Desmos). Located at: https://www.desmos.com/calculator/ha6gh59rq7. License: CC BY: Attribution
- Interactive: Transform Quadratic 4. Provided by: Lumen Learning (with Desmos). Located at: https://www.desmos.com/calculator/pimelalx4i. License: CC BY: Attribution
- Revision and Adaptation. Provided by: Lumen Learning. License: CC BY: Attribution
- College Algebra. Authored by: Abramson, Jay et al.. Provided by: OpenStax. Located at: http://cnx.org/contents/9b08c294-057f-4201-9f48-5d6ad992740d@5.2. License: CC BY: Attribution. License Terms: Download for free at http://cnx.org/contents/9b08c294-057f-4201-9f48-5d6ad992740d@5.2