At the start of this module, you were given the challenge of designing a roller coaster given a set of criteria. Now that you know a bit about polynomials, let’s take another look at the coaster in terms of a polynomial as a function of time, [latex]t[/latex].
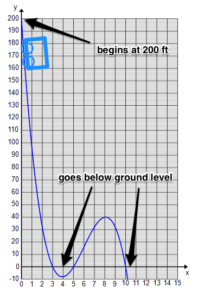
- The starting height of the coaster must be 200 ft, so [latex]f(0)=200[/latex].
- At [latex]t=3[/latex], the roller coaster goes below ground level, (3, 0).
- At [latex]t=5[/latex], the roller coaster returns to ground level, (5, 0).
- At [latex]t=10[/latex], the roller coaster goes below ground level again, (10, 0).
So you can begin to write the polynomial function to represent the criteria. The height as a function of time can be written as follows:
[latex]f\left(t\right)=a\left(t-3\right)\left(t-5\right)\left(t-10\right)[/latex]
[latex]f\left(t\right)=a\left(t3-18t^2+95t-150\right)[/latex]
[latex]f\left(0\right)=-150a-200[/latex]
[latex]a=-4/3[/latex]
[latex]f(t)=-4/3(t3-18t^2+95t-150)[/latex]
Graphing this polynomial will help you analyze the design better. One way to graph a polynomial function is to first find the intercepts. Earlier you found the intercepts [latex](0, 200), (3, 0), (5, 0)[/latex], and [latex](10, 0)[/latex].
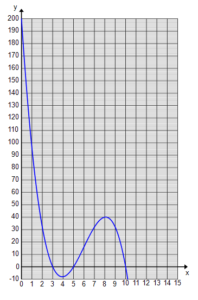
In this particular case, the graph helps you visualize the shape of your coaster. The starting point on the graph shows the starting point of the coaster. The negative slope shows where the coaster will drop. The [latex]x[/latex]-intercepts show the times at which the coaster is at ground level. You can quickly see how the coaster will rise and fall for this portion of the ride.
So this is turning out to be a scary roller coaster already, and you have only designed 10 seconds of it. Imagine what you can do in the other 40 seconds of the roller coaster ride!
Candela Citations
- Putting It Together: Power and Polynomial Functions. Authored by: Lumen Learning. License: CC BY: Attribution
- Polynomial Graph. Authored by: Christine Caputo for Lumen. License: CC BY: Attribution
- Polynomial Graph with Roller Coaster. Authored by: Lumen. License: CC BY: Attribution