Learning Outcomes
- Identify common types of internal and external data used for business reports
- Explain the role of primary research and the most common forms that are used
- Explain secondary research and how it is used to provide support to the report
Figure 1 shows frequency data—the amount of something over a given period of time.
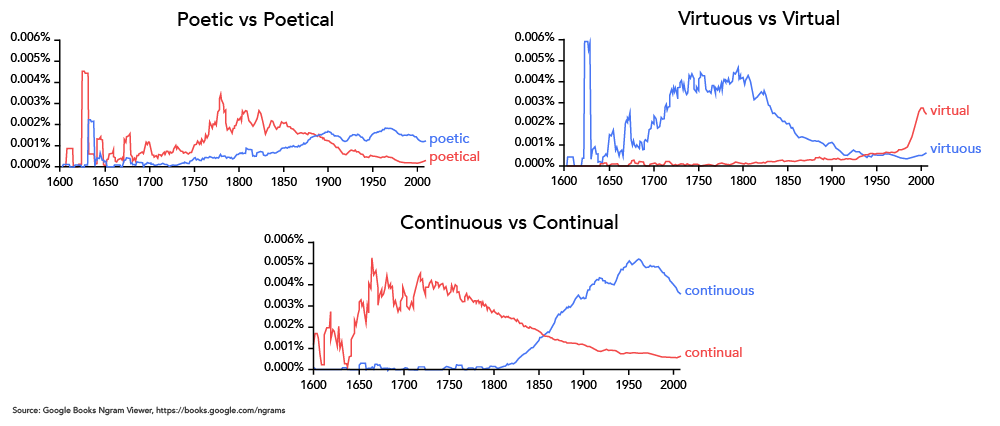
Figure 1. Comparison of word usage from 1600 to 2018
Various types of data are very useful for business reports, and in business reports, you will quickly come across things like revenue (money earned in a given period, usually a year), turnover (people who left the organization in a given period), and many others.
There are a variety of data available when one is constructing a business report. We may categorize data in the following manner:
- Internal
- Employee headcount
- Employee demographics (e.g., sex, ethnicity, marital status)
- Financials (e.g., revenue, profit, cost of goods sold, margin, operating ratio)
- External
- Number of vendors used
- Number of clients in a company’s book of business
- Size of the industry (e.g. number of companies, total capital)
Internal and external business or organizational data come in two main categories: qualitative and quantitative.
- Qualitative data are generally non-numeric and require context, time, or variance to have meaning or utility.
- Examples: taste, energy, sentiments, emotions
- Quantitative data are numeric and therefore largely easier to understand.
- Example: temperature, dimensions (e.g., length), prices, headcount, stock on hand
Both types of data are useful for business report writing. Usually a report will feature as much “hard” quantitative data as possible, typically in the form of earnings or revenue, headcount, and other numerical data available. Most organizations keep a variety of internal quantitative data. Qualitative data, such as stories, case studies, or narratives about processes or events, are also very useful, and provide context. We may consider that a good report will have both types of data, and a good report writer will use both types of data to build a picture of information for their readers.
Practice Question
10-K
A common report required of all publicly traded companies is the 10-K. This is an annual report that all public companies in the US have to file with the US Securities and Exchange Commission (SEC). For example, you can take a look at Apple’s 10-K form.
Figure 2 shows Apple’s 10-K’s table of contents, and illustrates common types of data used. Note how much of it is quantitative based (Item 6 for example,) however other data, such as leadership biographies (Item 10), also provides context.

Figure 2. Apple’s 10-K
Primary Research
Primary research is usually defined as research you collect yourself.
This type of research is done to fill in gaps found during secondary research review. That is, one does not conduct primary research if you can address your research question with already existing secondary sources.
Think back to Martha’s case we discussed earlier in this module; her interviews of homeless people in downtown Chicago are primary research. She is doing these interviews only because her existing secondary sources lack something she feels she needs now to properly answer her research question (about the current experience of homeless families in downtown Chicago). Primary research is used to supplement gaps in more accessible secondary research.
Purdue University’s Online Writing Lab describes the following as typical primary research:
- Interviews: Interviews are conversations, typically in small groups, where one party asks questions of another. Interviews are usually conducted in-person, between two people (the person asking questions and the person answering them); however, these can also take place over the phone, and may involve multiple parties.
- Surveys: Surveys are typically written documents that are sent out to individuals to fill out. Surveys are more rigid than interviews, as an interviewer can change their planned questions based on the subject’s responses. Surveys, however are pre-written and can only respond in limited anticipated ways.
- Observations: Observations are just what they sound like: the researcher watches something and records what they see. It is important to avoid influencing whatever you’re watching. However, if it’s impossible to not influence your subject, make sure to include the fact that your presence may have influenced your observations.
- Analysis: In analysis, gathered data is examined and organized so those who are less familiar with technical details can be guided through the data. Analysis can also help uncover patterns and trends in data.
Secondary Research
Secondary research is gathering information from other people’s primary research.
Common forms are books, journals, newspaper articles, media reports, and other polished accounts of data. Most report writers will use secondary sources for their business reports in order to gather, curate, and present the material in a new, updated and helpful manner. Using secondary research is far less costly, more efficient, and requires less time to gather data from already developed sources.
In business, where everything has a cost, we may argue for maximizing secondary sources alone because primary research is expensive and time consuming. That said, primary and secondary data should interact, and as discussed, we gather primary data when we find gaps in the already available secondary sources.
Secondary sources analyze, review, or summarize information in primary resources or other secondary resources. Even sources presenting facts or descriptions about events are secondary unless they are based on direct participation or observation.
One example of secondary research is this McKinsey and Company report on the Future of Work After Covid 19. Note how they have summarized other sources in a manageable report. Scroll through the entire article to see how they have summarized data from the US Department of Labor and the US Bureau of Labor Statistics alongside advice for the future from their company.
Practice Questions
Candela Citations
- Types of Data Sources. Authored by: Freedom Learning Group. Provided by: Lumen Learning. License: CC BY: Attribution
- Comparison of word usage image. Provided by: Lumen Learning. License: CC BY: Attribution
- Screenshot of Apple's 10-K. Authored by: Freedom Learning Group. Provided by: Lumen Learning. License: CC BY: Attribution