Learning Outcomes
- Create a Word document with integrated Excel chart.
There are a couple of ways to integrate an Excel chart into a Word document.
Option 1 for Chart Integration
The next piece of information needed in the report is the annual sales chart. To enter this data, Rosamine makes sure her cursor is at the place in the report she wants the chart to go. She clicks back to the Insert tab and selects the Chart button.

The next step is to select the type of chart to use for her report. In this instance, Rosamine chooses a line chart.

- Chart Button/Line Chart. Rosamine selects the chart button and then selects a Line chart to use in her report.
- Chart Options. There are seven different variations for displaying a Line chart. Rosamine selects the first option.
- OK Button. With the desired chart selected, Rosamine clicks the OK button and the chart is placed in her report.
Next, Rosamine selects the style of line chart to use and begins to enter information to create the chart itself.

The chart will contain the total sales numbers from the last three years for each of the three retail stores. She puts the years in Column A (purple color), the name of the stores across row 1 (pink color), and the sales figures in the rest of the cells (blue color). Here is what her chart now looks like in the report.

Rosamine clicks on the chart title box and changes the name of the chart to Annual Total Sales. Rosamine notices that the numbers are difficult to see, so she resizes the chart to make it easier to read.
Rosamine resizes the chart by clicking on the mid-points in the chart and dragging them to a larger size that still fits within the document column width.

The General Manager will now see the rise and fall of sales over the last three years in Rosamine’s report.
To finish the report, Rosamine types in the rest of the text. Next she needs to link a PowerPoint presentation file for a reference mentioned in the report.
Option 2 for Chart Integration
What if Rosamine already had access to the Annual Total Sales chart file? She could copy and paste the chart into her document. First she opens the Excel file with the chart in it. Since she has learned to copy and paste from the previous table, she puts the Word and Excel windows side-by-side on her screen, then takes the following steps:
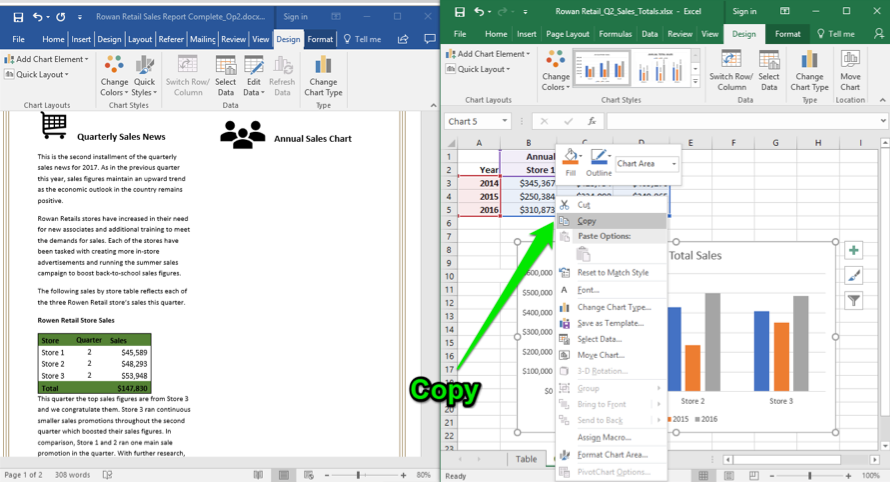
- Select chart. Rosamine selects the chart in the Excel file by clicking once on the chart.
- Right-click mouse. Rosamine clicks the right mouse button. She sees a menu appear and selects the Copy choice. She can also use the Ctrl+C keys to copy the chart.

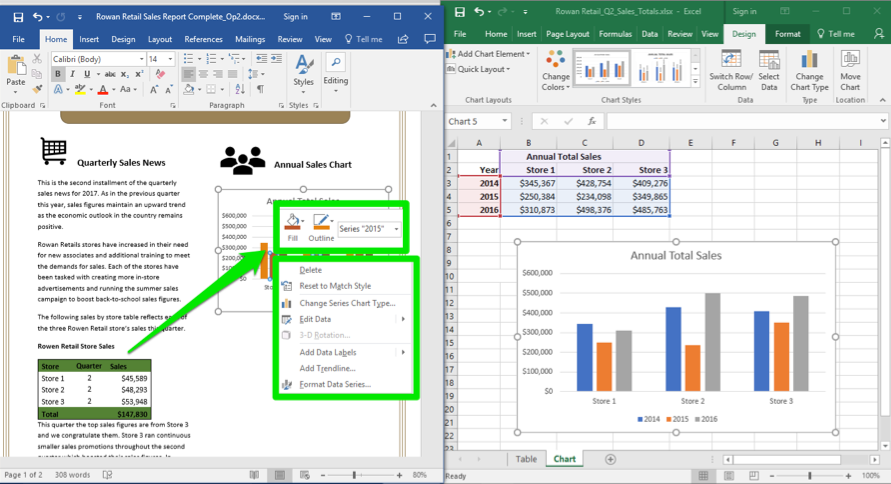
- Paste chart in Word document. With the desired chart copied, Rosamine moves over to her Word document and places the curser in the correct spot and right-clicks again to bring up the menu. In the menu she selects the Paste option and the chart is placed in the document. She can also use the Ctrl+V keys to paste the chart.
- Resize chart. Rosamine now grabs one of the chart border area spots and moves it to the desired size in the document.

- Change chart. If Rosamine needed to change something about the chart like the type of chart, the data in the chart, the labels, and so on, she can right-click on the chart itself, and a menu will appear that allows her to change aspects of that chart. Any changes made will not affect the original Excel file chart.
If Rosamine wanted to use the copy and paste keyboard shortcut it would be exactly like the copy and paste from the table example and look like this:

To finish the report, Rosamine types in the rest of the text. Next, she needs to link a PowerPoint presentation file for a reference mentioned in the report.
Practice Questions
Candela Citations
- Excel Chart in Word Document. Authored by: Sherri Pendleton. Provided by: Lumen Learning. License: CC BY: Attribution
