Learning outcomes
- Construct a confidence interval to estimate the difference between two population proportions (or the size of a treatment effect) when conditions are met. Interpret the confidence interval in context.
- Given the description of a statistical study, evaluate whether conclusions are reasonable.
Drawing Conclusions from Confidence Intervals
It is tempting to get involved in the details of calculating and interpreting a confidence interval without thinking about how the data was collected. Whether we are calculating a confidence interval or performing a hypothesis test, the results are meaningless without a properly designed study.
Here is a quick review of what we already know about the connection between study design, use of inference procedures, and valid conclusions.
- The goal of statistical inference is to use sample statistics to estimate population parameters. Therefore, the data must be a representative sample of the population of interest. This also applies to inference that compares two population parameters.
- In general, we can use statistical inference procedures if the data come from randomly selected or randomly assigned individuals.
- Cause-and-effect conclusions are possible when we randomly assign individuals to treatment groups in a well-designed experiment.
- Since inference procedures are based on probability models, the data must also meet the specific conditions for the procedure we have chosen.
In the next activities, we apply these ideas to the use of confidence intervals for estimating a difference between two population proportions (or estimating a treatment effect.)
Try It
Does Involving a Statistician Improve the Chance That a Medical Research Paper Will Be Published?
The following excerpt from “How Statistical Expertise Is Used in Medical Research” (Altman, D. G., S. N. Goodman, and S. Schroter, Journal of the American Medical Association 287(21):2817–20, 2002) describes the data collection method for this study.
- Authors of original research articles who submitted to BMJ [British Medical Journal] and Annals of Internal Medicine from May through August 2001 were sent a short questionnaire….Authors were asked if they received assistance from a person with statistical expertise.
Of the 190 who did not work with a statistician, 134 had papers rejected without peer review. Of the 514 who did work with a statistician, 293 had papers rejected without peer review.
Comment
Even when inference is inappropriate, exploratory data analysis can give us important information. The authors of the previous study list two other reasons that their data “make inference difficult.” But they end their paper with the following statement. “Nevertheless, this study provides a picture of the norms and practices of this aspect of the medical research enterprise in 2001 and identifies several areas for possible exploration and improvement in the future.”
Try It
Community College Student Athletes and Steroid Use
Robert D. Kersey published an article titled “Anabolic-Androgenic Steroid Use among California Community College Student Athletes” (Journal of Athletic Trainers 31(3):237 – 41, 1996) comparing various aspects of users and nonusers. The study used an advanced random sampling technique to select 10 representative community colleges in California and then to select a random sample of student athletes from the 10 colleges. The group of 1,185 male and female student-athletes completed an anonymous questionnaire. Of the sample, 4.2% of the males and 1.2% of the females admitted to using steroids.
Let’s Summarize
Every confidence interval has the following form:
[latex]\mathrm{statistic}\text{}±\text{}\mathrm{margin}\text{}\mathrm{of}\text{}\mathrm{error}[/latex]
To estimate a difference in population proportions (or a treatment effect), the statistic is a difference in sample proportions, so the confidence interval is
[latex](\mathrm{difference}\text{}\mathrm{in}\text{}\mathrm{sample}\text{}\mathrm{proportions})\text{}±\text{}\mathrm{margin}\text{}\mathrm{of}\text{}\mathrm{error}[/latex]
The margin of error is based on the estimated standard error in the sampling distribution:
[latex]\sqrt{\frac{{\stackrel{ˆ}{p}}_{1}(1-{\stackrel{ˆ}{p}}_{1})}{{n}_{1}}+\frac{{\stackrel{ˆ}{p}}_{2}(1-{\stackrel{ˆ}{p}}_{2})}{{n}_{2}}}[/latex]
If a normal model is a good fit for the sampling distribution, then the 95% confidence interval is
[latex](\mathrm{difference}\text{}\mathrm{in}\text{}\mathrm{sample}\text{}\mathrm{proportions})\text{}±\text{}2(\mathrm{standard}\text{}\mathrm{error})[/latex]
[latex]({\stackrel{ˆ}{p}}_{1}-{\stackrel{ˆ}{p}}_{2})\text{}±\text{}2\sqrt{\frac{{\stackrel{ˆ}{p}}_{1}(1-{\stackrel{ˆ}{p}}_{1})}{{n}_{1}}+\frac{{\stackrel{ˆ}{p}}_{2}(1-{\stackrel{ˆ}{p}}_{2})}{{n}_{2}}}[/latex]
Use this formula only if a normal model is a good fit for the sampling distribution. A normal model is a good fit when the counts of successes and failures in both samples are at least 10.
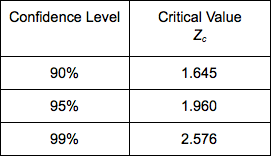
When the conditions for normality are met, the confidence level is related to margin of error. To find a confidence interval for a different level of confidence, replace 2 with the appropriate z-score.

There are many differences between sample proportions, [latex]{\stackrel{ˆ}{p}}_{1}-{\stackrel{ˆ}{p}}_{2}[/latex]. Each of these differences generates its own confidence interval. The proportion of confidence intervals that contains the difference between the population proportions, [latex]{p}_{1}-{p}_{2}[/latex], is equal to the level of confidence.
As always, “garbage in, garbage out.” The results of a confidence interval are meaningless without a properly designed study.
Contribute!
Candela Citations
- Concepts in Statistics. Provided by: Open Learning Initiative. Located at: http://oli.cmu.edu. License: CC BY: Attribution