Learning outcomes
- Recognize when to use a hypothesis test or a confidence interval to compare two population proportions or to investigate a treatment effect for a categorical variable.
- Under appropriate conditions, conduct a hypothesis test for comparing two population proportions or two treatments. State a conclusion in context.
Introduction
In Inference for Two Proportions, our focus is on inference that compares two populations or two treatments with a categorical response variable. The parameters and statistics are proportions. In the section “Estimate the Difference between Population Proportions,” we learned how to use a difference in sample proportions to calculate a confidence interval. The confidence interval estimates a treatment effect or the difference between two population proportions. In this section, “Hypothesis Test for a Difference in Population Proportions,” we learn to use a difference in sample proportions to test a hypothesis about a treatment effect or a hypothesis that compares two population proportions.
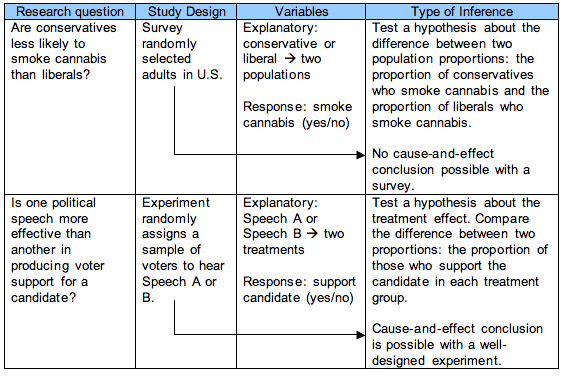
We did hypothesis tests in Inference for One Proportion. Each claim involved a single population proportion. Now we will test claims about a treatment effect or about a difference in population proportions, and we’ll see that the steps and the logic of the hypothesis test are the same. Before we get into the details, let’s practice identifying research questions and studies that involve two populations or two treatments with a categorical response variable. Here are some examples.
Try It
Try It
Try It
Stating Hypotheses about Two Population Proportions
Whenever we test a hypothesis, we begin by stating null and alternative hypotheses.
The null hypothesis is a statement of “no effect” or “no difference,” so the null hypothesis for all hypothesis tests about two population proportions is H0: p1 − p2 = 0. When we say there is no difference in the population proportions (or no treatment effect), it is equivalent to saying that the population proportions are equal: p1 = p2.
The alternative hypothesis is one of the following:
- Ha: p1 − p2 > 0 (or p1 > p2)
- Ha: p1 − p2 < 0 (or p1 < p2)
- Ha: p1 − p2 ≠ 0 (or p1 ≠ p2)
Example
The Abecedarian Project
Will early childhood education improve the likelihood of college attendance for poor children? Recall the experiment conducted by the Abecedarian (A-B-C-Darian) project in the 1970s. The study randomly assigned children to a control group (with no preschool) or a treatment group (with high-quality preschool).
To test the claim that the treatment increases the proportion of children who eventually attend college, we define a null and an alternative hypothesis.
Define p1 to be the proportion of children who attend a quality preschool and eventually go to college. Define p2 to be the proportion of children who did not attend preschool but eventually go to college.
The null hypothesis is always a statement of “no effect” or “no difference,” so we assume that these proportions are equal: p1 = p2. Their difference is therefore zero:
- H0: p1 − p2 = 0
In this example, the null hypothesis says that the preschool treatment has no effect on the proportion of children who eventually go to college.
The alternative hypothesis reflects our claim of a treatment effect. We chose to make p1 connected to the treatment, so our claim says that p1 is greater than p2 (p1 > p2). This translates into a difference that is greater than zero. It is positive:
- Ha: p1 − p2 > 0
Establishing the null and alternative hypotheses in a comparison of two proportions is an important part of the hypothesis testing process. The next few activities provide an opportunity to practice this skill.
Try It
Contribute!
Candela Citations
- Concepts in Statistics. Provided by: Open Learning Initiative. Located at: http://oli.cmu.edu. License: CC BY: Attribution