Learning Outcomes
- Write functions using algebraic notation
- Use the vertical line test to determine whether a graph represents a function
Some people think of functions as “mathematical machines.” Imagine you have a machine that changes a number according to a specific rule such as “multiply by [latex]3[/latex] and add [latex]2[/latex]” or “divide by [latex]5[/latex], add [latex]25[/latex], and multiply by [latex]−1[/latex].” If you put a number into the machine, a new number will pop out the other end having been changed according to the rule. The number that goes in is called the input, and the number that is produced is called the output.
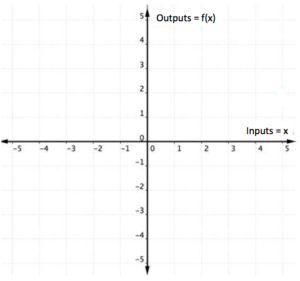
You can also call the machine “f” for function. If you put x into the box, f(x), comes out. Mathematically speaking, x is the input, or the “independent variable,” and f(x) is the output, or the “dependent variable,” since it depends on the value of x.
[latex]f(x)=4x+1[/latex] is written in function notation and is read “f of x equals [latex]4x[/latex] plus [latex]1[/latex].” It represents the following situation: A function named f acts upon an input, x, and produces f(x) which is equal to [latex]4x+1[/latex]. This is the same as the equation [latex]y=4x+1[/latex].
Function notation gives you more flexibility because you do not have to use y for every equation. Instead, you could use f(x) or g(x) or c(x). This can be a helpful way to distinguish equations of functions when you are dealing with more than one at a time.
Using Function Notation
Once we determine that a relationship is a function, we need to display and define the functional relationship so that we can understand it, use it, and possibly even program it into a computer. There are various ways of representing functions. A standard function notation is one representation that facilitates working with functions.
Now you try it.
Example
Represent height as a function of age using function notation.
Now try another.
Example
- Write the formula for perimeter of a square, [latex]P=4s[/latex], as a function.
- Write the formula for area of a square, [latex]A=l^{2}[/latex], as a function.
This would make it easy to graph both functions on the same graph without confusion about the variables.
We can also use an algebraic expression as the input to a function. For example [latex]f\left(a+b\right)[/latex] means “first add a and b, and the result is the input for the function [latex]f[/latex].” The operations must be performed in this order to obtain the correct result.
Function Notation
The notation [latex]y=f\left(x\right)[/latex] defines a function named [latex]f[/latex]. This is read as “[latex]y[/latex] is a function of [latex]x[/latex].” The letter [latex]x[/latex] represents the input value, or independent variable. The letter [latex]y[/latex] or [latex]f\left(x\right)[/latex], represents the output value, or dependent variable.
Example
Use function notation to represent a function whose input is the name of a month and output is the number of days in that month.

Note that the inputs to a function do not have to be numbers; function inputs can be names of people, labels of geometric objects, or any other element that determines some kind of output. However, most of the functions we will work with in this book will have numbers as inputs and outputs.
Example
A function [latex]N=f\left(y\right)[/latex] gives the number of police officers, [latex]N[/latex], in a city in year [latex]y[/latex]. What does [latex]f\left(2005\right)=300[/latex] represent?
In the following videos we show two more examples of how to express a relationship using function notation.
Graphs of Functions
When both the independent quantity (input) and the dependent quantity (output) are real numbers, a function can be represented by a graph in the coordinate plane. The independent value is plotted on the x-axis and the dependent value is plotted on the y-axis. The fact that each input value has exactly one output value means graphs of functions have certain characteristics. For each input on the graph, there will be exactly one output. For a function defined as [latex]y = f(x)[/latex], or y is a function of [latex]x[/latex], we would write ordered pairs [latex](x, f(x))[/latex] using function notation instead of [latex](x,y)[/latex] as you may have seen previously.
We can identify whether the graph of a relation represents a function because for each x-coordinate there will be exactly one y-coordinate.
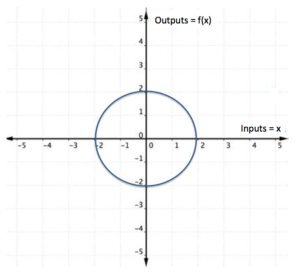
When a vertical line is placed across the plot of this relation, it does not intersect the graph more than once for any values of x.
If, on the other hand, a graph shows two or more intersections with a vertical line, then an input (x-coordinate) can have more than one output (y-coordinate), and y is not a function of x. Examining the graph of a relation to determine if a vertical line would intersect with more than one point is a quick way to determine if the relation shown by the graph is a function. This method is often called the “vertical line test.”
You try it.
Example
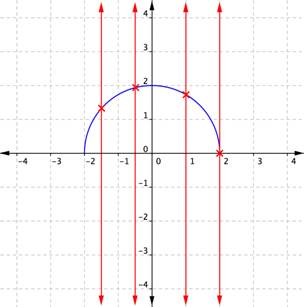
Use the vertical line test to determine whether the relation plotted on this graph is a function.

The vertical line method can also be applied to a set of ordered pairs plotted on a coordinate plane to determine if the relation is a function.
Example
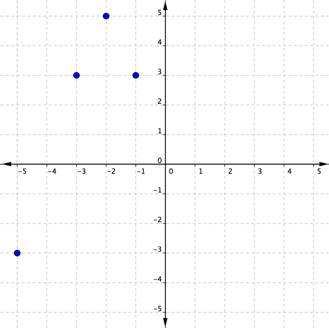
Consider the ordered pairs [latex]\{(−1,3),(−2,5),(−3,3),(−5,−3)\}[/latex] plotted on the graph below. Use the vertical line test to determine whether the set of ordered pairs represents a function.

Now consider the set of ordered pairs [latex]\{(3,−1),(5,−2),(3,−3),(−3,5)\}[/latex]. One of the inputs, [latex]3[/latex], can produce two different outputs, [latex]−1[/latex] and [latex]−3[/latex]. You know what that means—this set of ordered pairs is not a function. A plot confirms this.
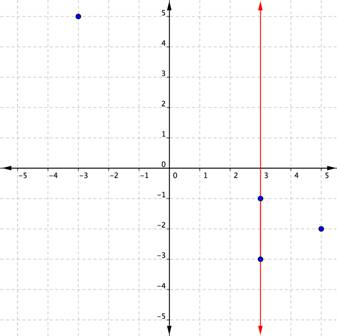
Notice that a vertical line passes through two plotted points. One x-coordinate has multiple y-coordinates. This relation is not a function.
In the following video, we show another example of determining whether a graph represents a function using the vertical line test.
Candela Citations
- Revision and Adaptation. Provided by: Lumen Learning. License: CC BY: Attribution
- Ex: Function Notation Application Problem. Authored by: James Sousa (Mathispower4u.com) . Located at: https://youtu.be/lF0fzdaxU_8. License: CC BY: Attribution
- Function Notation Application. Authored by: James Sousa (Mathispower4u.com) for Lumen Learning. Located at: https://youtu.be/nAF_GZFwU1g. License: CC BY: Attribution
- College Algebra. Provided by: OpenStax. Located at: http://cnx.org/contents/9b08c294-057f-4201-9f48-5d6ad992740d@3.278:1/Preface. License: CC BY: Attribution. License Terms: Download for free at : http://cnx.org/contents/9b08c294-057f-4201-9f48-5d6ad992740d@3.278:1/Preface
- Ex: Determine if a Table of Values Represents a Function. Authored by: James Sousa (Mathispower4u.com) for Lumen Learning. Located at: https://youtu.be/y2TqnP_6M1s. License: CC BY: Attribution
