What you’ll learn to do: Plot lines on the rectangular coordinate system using x- and y-intercepts
One of the easiest ways to graph a line is by using the x- and y- intercepts as two of your points.
In this section, we will learn how to:
- Identify the x- and y-intercepts on a graph and as ordered pairs
- Find the intercepts from an equation of a line
- Graph a linear equation using x and y-intercepts
Before you get started in this module, try a few practice problems and review prior concepts.
readiness quiz
1)
Solve: [latex]3x+4y=-12[/latex] for [latex]x[/latex] when [latex]y=0[/latex].
Solution: [latex]x=-4[/latex]
2)
If you missed this problem, review this example.
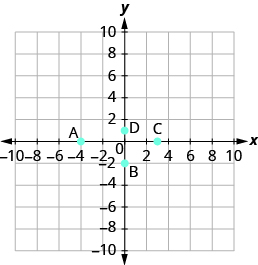
Name the ordered pair of each point shown:

Show Solution
Solution
| Point A is on the x-axis at [latex]x=-4[/latex] . |
The coordinates of point A are [latex]\left(-4,0\right)[/latex] . |
| Point B is on the y-axis at [latex]y=-2[/latex] |
The coordinates of point B are [latex]\left(0,-2\right)[/latex] . |
| Point C is on the x-axis at [latex]x=3[/latex] . |
The coordinates of point C are [latex]\left(3,0\right)[/latex] . |
| Point D is on the y-axis at [latex]y=1[/latex] . |
The coordinates of point D are [latex]\left(0,1\right)[/latex] . |
3)
If you missed this problem, review the example below.
Determine which ordered pairs are solutions of the equation [latex]x+4y=8\text{:}[/latex]
1. [latex]\left(0,2\right)[/latex]
2. [latex]\left(2,-4\right)[/latex]
3. [latex]\left(-4,3\right)[/latex]
Show Solution
Solution
Substitute the [latex]x\text{- and}y\text{-values}[/latex] from each ordered pair into the equation and determine if the result is a true statement.
| 1. [latex]\left(0,2\right)[/latex] |
2. [latex]\left(2,-4\right)[/latex] |
3. [latex]\left(-4,3\right)[/latex] |
| [latex]x=\color{blue}{0}, y=\color{red}{2}[/latex]
[latex]x+4y=8[/latex]
[latex]\color{blue}{0}+4\cdot\color{red}{2}\stackrel{?}{=}8[/latex]
[latex]0+8\stackrel{?}{=}8[/latex]
[latex]8=8\checkmark[/latex] |
[latex]x=\color{blue}{2}, y=\color{red}{-4}[/latex]
[latex]x+4y=8[/latex]
[latex]\color{blue}{2}+4(\color{red}{-4})\stackrel{?}{=}8[/latex]
[latex]2+(-16)\stackrel{?}{=}8[/latex]
[latex]-14\not=8[/latex] |
[latex]x=\color{blue}{-4}, y=\color{red}{3}[/latex]
[latex]x+4y=8[/latex]
[latex]\color{blue}{-4}+4\cdot\color{red}{3}\stackrel{?}{=}8[/latex]
[latex]-4+12\stackrel{?}{=}8[/latex]
[latex]8=8\checkmark[/latex] |
| [latex]\left(0,2\right)[/latex] is a solution. |
[latex]\left(2,-4\right)[/latex] is not a solution. |
[latex]\left(-4,3\right)[/latex] is a solution. |
Candela Citations
CC licensed content, Shared previously
- Question ID: 146919, 146928. Authored by: Lumen Learning. License: CC BY: Attribution. License Terms: IMathAS Community License CC-BY + GPL
CC licensed content, Specific attribution
- Prealgebra. Provided by: OpenStax. License: CC BY: Attribution. License Terms: Download for free at http://cnx.org/contents/caa57dab-41c7-455e-bd6f-f443cda5519c@9.757


