Learning Outcome
- Graph radical functions using tables and transformations
Just like linear functions and quadratic functions, we can graph radical functions (such as square root functions) by choosing values for x and finding points that will be on the graph. Again, it is helpful to have some idea about what the graph will look like.
Think about the basic square root function, [latex]f(x)=\sqrt{x}[/latex]. Take a look at a table of values for x and y and then graph the function. Notice that all the values for x in the table are perfect squares. Since you are taking the square root of x, using perfect squares makes more sense than just finding the square roots of [latex]0, 1, 2, 3, 4[/latex], etc.
| x | f(x) |
|---|---|
| [latex]0[/latex] | [latex]0[/latex] |
| [latex]1[/latex] | [latex]1[/latex] |
| [latex]4[/latex] | [latex]2[/latex] |
| [latex]9[/latex] | [latex]3[/latex] |
| [latex]16[/latex] | [latex]4[/latex] |
Recall that x can never be negative because when you square a real number, the result is always positive. For example, [latex]\sqrt{49}[/latex], this means “find the number whose square is [latex]49[/latex].” Since there is no real number that we can square and get a negative, the function [latex]f(x)=\sqrt{x}[/latex] will be defined for [latex]x\ge0[/latex].
Take a look at the graph.
Does the shape of the graph look a little familiar? It should. The graph of a radical function is half of a horizontal parabola. You could also think of it as half of a parabola lying on its side. As with parabolas, multiplying and adding numbers makes some changes, but the basic shape is still the same. Here are some examples.
Multiplying [latex]\sqrt{x}[/latex] by a positive value changes the width of the half-parabola. Multiplying [latex]\sqrt{x}[/latex] by a negative number gives you the other half of a horizontal parabola.
In the following example, we will show how multiplying a radical function by a constant can change the shape of the graph.
Example
Match each of the following functions to the graph that it represents.
a) [latex]f(x)=-\sqrt{x}[/latex]
b)[latex]f(x)=2\sqrt{x}[/latex]
c) [latex]f(x)=\dfrac{1}{2}\sqrt{x}[/latex]
1)
2)
3)
Adding a value outside the radical shifts the graph up or down. Think about it as adding the value to the basic y value of [latex]\sqrt{x}[/latex], so a positive value added moves the graph up.
Example
Match each of the following functions to the graph that it represents.
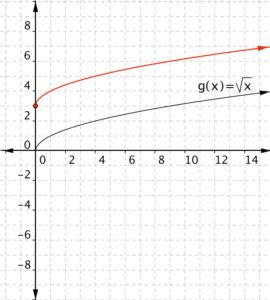
a) [latex]f(x)=\sqrt{x}+3[/latex]
b)[latex]f(x)=\sqrt{x}-2[/latex]
1)
2)
Adding a value inside the radical moves the graph left or right. Think about it as adding a value to x before you take the square root—so the y value gets moved to a different x value. For example, for [latex]f(x)=\sqrt{x}[/latex], the square root is [latex]3[/latex] if [latex]x=9[/latex]. For [latex]f(x)=\sqrt{x+1}[/latex], the square root is [latex]3[/latex] when [latex]x+1[/latex] is [latex]9[/latex], so when [latex]x[/latex] is [latex]8[/latex]. Changing [latex]x[/latex] to [latex]x+1[/latex] shifts the graph to the left by [latex]1[/latex] unit (for example, from [latex]9[/latex] to [latex]8[/latex]). Changing [latex]x[/latex] to [latex]x−2[/latex] shifts the graph to the right by [latex]2[/latex] units.
Example
Match each of the following functions to the graph that it represents.
a) [latex]f(x)=\sqrt{x+1}[/latex]
b)[latex]f(x)=\sqrt{x-2}[/latex]
1)
2)
Notice that as x gets greater, adding or subtracting a number inside the square root has less of an effect on the value of y.
In the next example, we will combine some of the changes that we have seen into one function.
Example
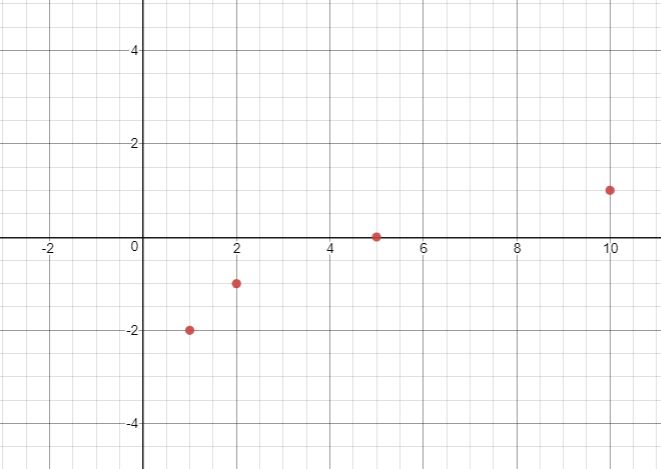
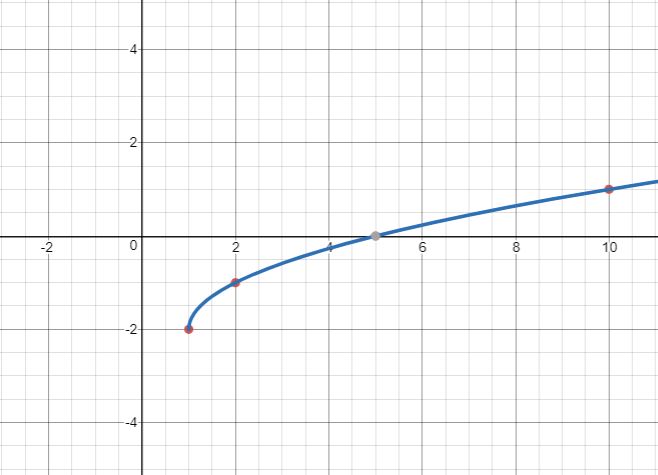
Graph [latex]f(x)=-2+\sqrt{x-1}[/latex].
Candela Citations
- Chapter 17. Authored by: Monterey Institute for Technology and Education. Located at: http://nrocnetwork.org/dm-opentext. License: CC BY: Attribution
