Learning Outcomes
- Find the slope of a line from its graph
- Find the slope of horizontal and vertical lines
The mathematical definition of slope is very similar to our everyday one. In math, slope is used to describe the steepness and direction of lines. In this section, we will begin exploring the concept of slope using a geoboard and then we will learn how to measure the slopes of lines on a rectangular coordinate system.
Using rubber bands on a geoboard gives a concrete way to model lines on a coordinate grid. By stretching a rubber band between two pegs on a geoboard, we can discover how to find the slope of a line. We’ll start by stretching a rubber band between two pegs to make a line as shown in the image below.

Does it look like a line?
Now we stretch one part of the rubber band straight up from the left peg and around a third peg to make the sides of a right triangle as shown in the image below. We carefully make a [latex]90^ \circ[/latex] angle around the third peg, so that one side is vertical and the other is horizontal.

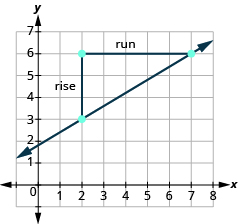
To find the slope of the line, we measure the distance along the vertical and horizontal legs of the triangle. The vertical distance is called the rise and the horizontal distance is called the run, as shown below.
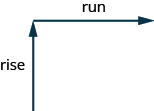
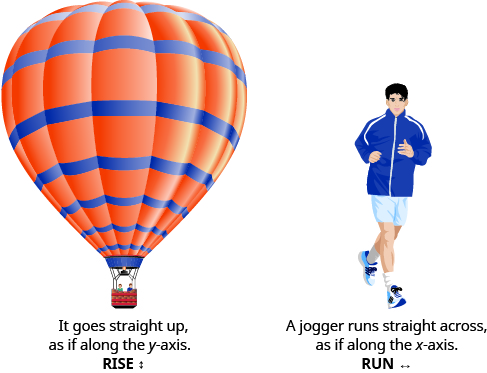
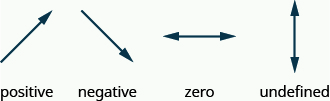
To help remember the terms, it may help to think of the images shown below.
On our geoboard, the rise is [latex]2[/latex] units because the rubber band goes up [latex]2[/latex] spaces on the vertical leg. See the image below.
What is the run? (Be sure to count the spaces between the pegs rather than the pegs themselves!) The rubber band goes across [latex]3[/latex] spaces on the horizontal leg, so the run is [latex]3[/latex] units.
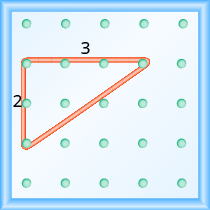
The slope of a line is the ratio of the rise to the run. So the slope of our line is [latex]{\Large\frac{2}{3}}[/latex]. In mathematics, the slope is always represented by the letter [latex]m[/latex].
Slope of a line
The slope of a line is [latex]m={\Large\frac{\text{rise}}{\text{run}}}[/latex].
The rise measures the vertical change and the run measures the horizontal change.
What is the slope of the line on the geoboard in the image above?
[latex]m={\Large\frac{\text{rise}}{\text{run}}}[/latex]
[latex]m={\Large\frac{2}{3}}[/latex]
The line has slope [latex]{\Large\frac{2}{3}}[/latex]
When we work with geoboards, it is a good idea to get in the habit of starting at a peg on the left and connecting to a peg to the right. Then we stretch the rubber band to form a right triangle.
If we start by going up when we connect the second peg, the rise is positive, and if we stretch it down the rise is negative. We will count the run from left to right, just like you read this paragraph, so the run will be positive.
Since the slope formula is rise over run, it may be easier to always count out the rise first and then the run.
example
What is the slope of the line on the geoboard shown?

Solution
Use the definition of slope.
[latex]m={\Large\frac{\text{rise}}{\text{run}}}[/latex]
Start at the left peg and make a right triangle by stretching the rubber band up and to the right to reach the second peg.
Count the rise and the run as shown.
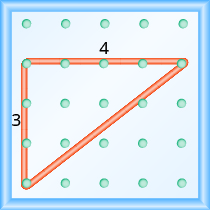
[latex]\begin{array}{cccc}\text{The rise is }3\text{ units}.\hfill & & & m={\Large\frac{3}{\text{run}}}\hfill \\ \text{The run is}4\text{ units}.\hfill & & & m={\Large\frac{3}{4}}\hfill \\ & & & \text{The slope is }{\Large\frac{3}{4}}\hfill \end{array}[/latex]
example
What is the slope of the line on the geoboard shown?


try it
Finding the Slope of a Line from its Graph
By just looking at the graph of a line, you can learn some things about its slope, especially relative to other lines graphed on the same coordinate plane. Consider the graphs of the three lines shown below:
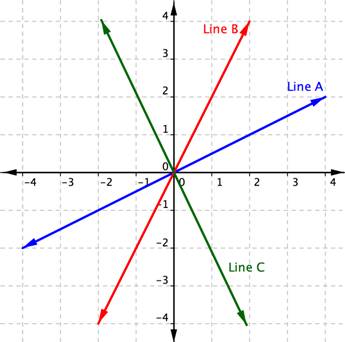
First, let’s look at lines A and B. If you imagined these lines to be hills, you would say that line B is steeper than line A. Line B has a greater slope than line A.
Next, notice that lines A and B slant up as you move from left to right. We say these two lines have a positive slope. Line C slants down from left to right. Line C has a negative slope. Using two of the points on the line, you can find the slope of the line by finding the rise and the run. The vertical change between two points is called the rise, and the horizontal change is called the run. The slope equals the rise divided by the run: [latex]\displaystyle \text{Slope }=\frac{\text{rise}}{\text{run}}[/latex].
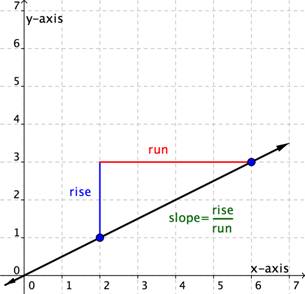
You can determine the slope of a line from its graph by looking at the rise and run. (Notice the similarity between the image above and the Geoboard examples we looked at earlier.) One characteristic of a line is that its slope is constant all the way along it. So, you can choose any 2 points along the graph of the line to figure out the slope. Let’s look at an example.
Example
Use the graph to find the slope of the line.
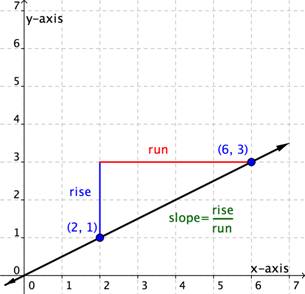
This line will have a slope of [latex]\displaystyle \frac{1}{2}[/latex] no matter which two points you pick on the line. Try measuring the slope from the origin, [latex](0,0)[/latex], to the point [latex](6,3)[/latex]. You will find that the [latex]\text{rise}=3[/latex] and the [latex]\text{run}=6[/latex]. The slope is [latex]\displaystyle \frac{\text{rise}}{\text{run}}=\frac{3}{6}=\frac{1}{2}[/latex]. It is the same!
Let’s look at another example.
Example
Use the graph to find the slope of the two lines.
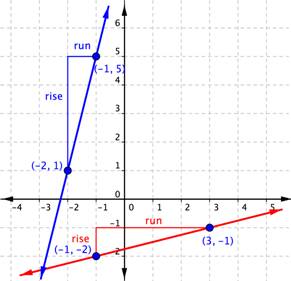
When you look at the two lines, you can see that the blue line is steeper than the red line. It makes sense the value of the slope of the blue line, [latex]4[/latex], is greater than the value of the slope of the red line, [latex]\displaystyle \frac{1}{4}[/latex]. The greater the slope, the steeper the line.
Finding the Slope of a Line From a Graph
Distinguish between graphs of lines with negative and positive slopes
Direction is important when it comes to determining slope. It’s important to pay attention to whether you are moving up, down, left, or right; that is, if you are moving in a positive or negative direction. If you go up to get to your second point, the rise is positive. If you go down to get to your second point, the rise is negative. If you go right to get to your second point, the run is positive. If you go left to get to your second point, the run is negative.
In the following two examples, you will see a slope that is positive and one that is negative.
Example (Advanced)
Find the slope of the line graphed below.
The next example shows a line with a negative slope.
Example
Find the slope of the line graphed below.
In all of the previous examples of finding the slope of a line, we were given two points. Now we will look at some examples where we are not automatically given two points on the line.
To find the slope, we must count out the rise and the run. But where do we start?
We locate any two points on the line. We try to choose points with coordinates that are integers to make our calculations easier. We then start with the point on the left and sketch a right triangle, so we can count the rise and run.
example
Find the slope of the line shown:
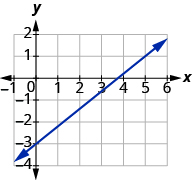
Solution
Locate two points on the graph, choosing points whose coordinates are integers. We will use [latex]\left(0,-3\right)[/latex] and [latex]\left(5,1\right)[/latex].
Starting with the point on the left, [latex]\left(0,-3\right)[/latex], sketch a right triangle, going from the first point to the second point, [latex]\left(5,1\right)[/latex].
 |
|
| Count the rise on the vertical leg of the triangle. | The rise is [latex]4[/latex] units. |
| Count the run on the horizontal leg. | The run is [latex]5[/latex] units. |
| Use the slope formula. | [latex]m={\Large\frac{\text{rise}}{\text{run}}}[/latex] |
| Substitute the values of the rise and run. | [latex]m={\Large\frac{4}{5}}[/latex] |
| The slope of the line is [latex]{\Large\frac{4}{5}}[/latex] . |
Notice that the slope is positive since the line slants upward from left to right.
try it
Find the slope from a graph
- Locate two points on the line whose coordinates are integers.
- Starting with the point on the left, sketch a right triangle, going from the first point to the second point.
- Count the rise and the run on the legs of the triangle.
- Take the ratio of rise to run to find the slope. [latex]m={\Large\frac{\text{rise}}{\text{run}}}[/latex]
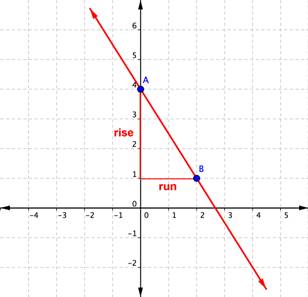
example
Find the slope of the line shown:
Notice that the slope is negative since the line slants downward from left to right.
What if we had chosen different points? Let’s find the slope of the line again, this time using different points. We will use the points [latex]\left(-3,7\right)[/latex] and [latex]\left(6,1\right)[/latex].
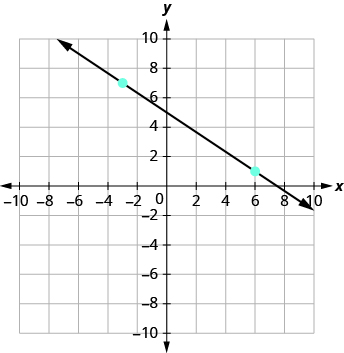
Starting at [latex]\left(-3,7\right)[/latex], sketch a right triangle to [latex]\left(6,1\right)[/latex].
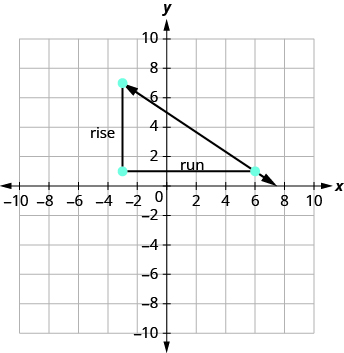
| Count the rise. | The rise is [latex]−6[/latex]. |
| Count the run. | The run is [latex]9[/latex]. |
| Use the slope formula. | [latex]m=\Large\frac{\text{rise}}{\text{run}}[/latex] |
| Substitute the values of the rise and run. | [latex]m={\Large\frac{-6}{9}}[/latex] |
| Simplify the fraction. | [latex]m=-{\Large\frac{2}{3}}[/latex] |
| The slope of the line is [latex]-{\Large\frac{2}{3}}[/latex]. |
It does not matter which points you use—the slope of the line is always the same. The slope of a line is constant!
try it
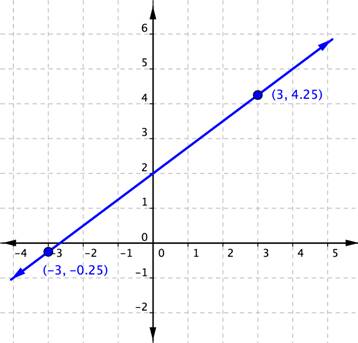
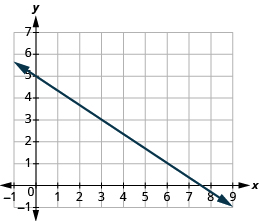
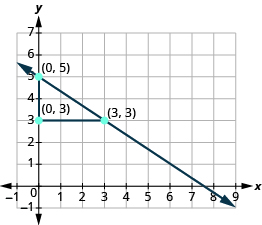
The lines in the previous examples had [latex]y[/latex] -intercepts with integer values, so it was convenient to use the y-intercept as one of the points we used to find the slope. In the next example, the [latex]y[/latex] -intercept is a fraction. The calculations are easier if we use two points with integer coordinates.
example
Find the slope of the line shown:

try it
In the following video we show another example of how to find the slope of a line given a graph. This graph has a positive slope.
In the following video we show another example of how to find the slope of a line given a graph. This graph has a negative slope.
Finding the Slope of Horizontal and Vertical Lines
Do you remember what was special about horizontal and vertical lines? Their equations had just one variable.
- horizontal line [latex]y=b[/latex]; all the [latex]y[/latex] -coordinates are the same.
- vertical line [latex]x=a[/latex]; all the [latex]x[/latex] -coordinates are the same.
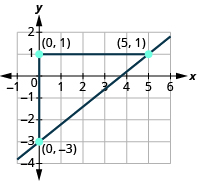
So how do we find the slope of the horizontal line [latex]y=4?[/latex] One approach would be to graph the horizontal line, find two points on it, and count the rise and the run. Let’s see what happens. We’ll use the two points [latex]\left(0,4\right)[/latex] and [latex]\left(3,4\right)[/latex] to count the rise and run.
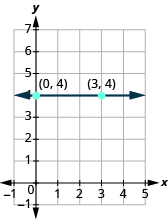
| What is the rise? | The rise is [latex]0[/latex]. |
| What is the run? | The run is [latex]3[/latex]. |
| What is the slope? | [latex]m=\Large\frac{\text{rise}}{\text{run}}[/latex] |
| [latex]m={\Large\frac{0}{3}}[/latex] | |
| [latex]m=0[/latex] |
The slope of the horizontal line [latex]y=4[/latex] is [latex]0[/latex].
All horizontal lines have slope [latex]0[/latex] . When the [latex]y[/latex] -coordinates are the same, the rise is [latex]0[/latex] .
Slope of a Horizontal Line
The slope of a horizontal line, [latex]y=b[/latex], is [latex]0[/latex].
Now we’ll consider a vertical line, such as the line [latex]x=3[/latex], shown below. We’ll use the two points [latex]\left(3,0\right)[/latex] and [latex]\left(3,2\right)[/latex] to count the rise and run.
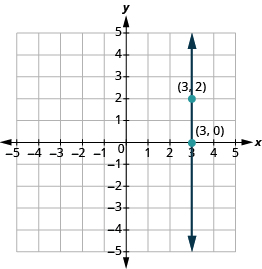
| What is the rise? | The rise is [latex]2[/latex]. |
| What is the run? | The run is [latex]0[/latex]. |
| What is the slope? | [latex]m=\Large\frac{\text{rise}}{\text{run}}[/latex] |
| [latex]m={\Large\frac{2}{0}}[/latex] |
But we can’t divide by [latex]0[/latex]. Division by [latex]0[/latex] is undefined. So we say that the slope of the vertical line [latex]x=3[/latex] is undefined. The slope of all vertical lines is undefined, because the run is [latex]0[/latex].
Slope of a Vertical Line
The slope of a vertical line, [latex]x=a[/latex], is undefined.
example
Find the slope of each line:
1. [latex]x=8[/latex]
2. [latex]y=-5[/latex]
try it
Quick Guide to the Slopes of Lines
The following example shows you how to determine the slope of horizontal and vertical lines that are plotted on the coordinate axes.
Candela Citations
- Determine the Slope of a Line From a Graph (No Formula). Authored by: Mathispower4u. Located at: https://youtu.be/29BpBqsiE5w. License: CC BY: Attribution
