Learning Outcomes
- Solve slope applications using equations and graphs
Solve Slope Applications
At the beginning of this section, we said there are many applications of slope in the real world. Let’s look at a few now. But first, let’s review the different kinds of slopes possible in a linear equation.
We often use specific words to describe the different types of slopes when we are using lines and equations to represent “real” situations. The following table pairs the type of slope with the common language used to describe it both verbally and visually.
| Type of Slope | Visual Description | Verbal Description |
| positive | uphill | increasing |
| negative | downhill | decreasing |
| [latex]0[/latex] | horizontal | constant |
| undefined | vertical | N/A |
Visual Interpretations of Slope
One of the ways that we can interpret slope is through a visual interpretation. You have heard us describe slope as going “uphill” or “downhill”. In the following application problems, we are interpreting slope visually in real-world contexts.
example
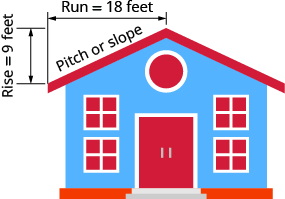
The pitch of a building’s roof is the slope of the roof. Knowing the pitch is important in climates where there is heavy snowfall. If the roof is too flat, the weight of the snow may cause it to collapse. What is the slope of the roof shown?
try it
example
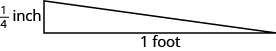
Have you ever thought about the sewage pipes going from your house to the street? Their slope is an important factor in how they take waste away from your house.
Sewage pipes must slope down [latex]{\Large\frac{1}{4}}[/latex] inch per foot in order to drain properly. What is the required slope?
try it
Verify Slope From a Dataset
Massive amounts of data is being collected every day by a wide range of institutions and groups. This data is used for many purposes including business decisions about location and marketing, government decisions about allocation of resources and infrastructure, and personal decisions about where to live or where to buy food.
In the following example, you will see how a dataset can be used to define the slope of a linear equation.
Example
Given the dataset, verify the values of the slopes of each equation.
Linear equations describing the change in median home values between [latex]1950[/latex] and [latex]2000[/latex] in Mississippi and Hawaii are as follows:
Hawaii: [latex]y=3966x+74,400[/latex]
Mississippi: [latex]y=924x+25,200[/latex]
The equations are based on the following dataset.
[latex]x[/latex] = the number of years since [latex]1950[/latex], and y = the median value of a house in the given state.
| Year (x) | Mississippi House Value (y) | Hawaii House Value (y) |
|---|---|---|
| [latex]0[/latex] | [latex]$25,200[/latex] | [latex]$74,400[/latex] |
| [latex]50[/latex] | [latex]$71,400[/latex] | [latex]$272,700[/latex] |
The slopes of each equation can be calculated with the formula you learned in the section on slope.
[latex]\displaystyle m=\frac{{{y}_{2}}-{{y}_{1}}}{{{x}_{2}}-{{x}_{1}}}[/latex]
Mississippi:
| Name | Ordered Pair | Coordinates |
|---|---|---|
| Point 1 | [latex](0, 25200)[/latex] | [latex]\begin{array}{l}x_{1}=0\\y_{1}=25200\end{array}[/latex] |
| Point 2 | [latex](50, 71400)[/latex] | [latex]\begin{array}{l}x_{2}=50\\y_{2}=71400\end{array}[/latex] |
[latex]\displaystyle m=\frac{{71,400}-{25,200}}{{50}-{0}}=\frac{{46,200}}{{50}} = 924[/latex]
We have verified that the slope [latex]\displaystyle m = 924[/latex] matches the dataset provided.
Hawaii:
| Name | Ordered Pair | Coordinates |
|---|---|---|
| Point 1 | [latex](0, 74400)[/latex] | [latex]\begin{array}{l}x_{1}=1950\\y_{1}=74400\end{array}[/latex] |
| Point 2 | [latex](50, 272700)[/latex] | [latex]\begin{array}{l}x_{2}=2000\\y_{2}=272700\end{array}[/latex] |
[latex]\displaystyle m=\frac{{272,700}-{74,400}}{{50}-{0}}=\frac{{198,300}}{{50}} = 3966[/latex]
We have verified that the slope [latex]\displaystyle m = 3966[/latex] matches the dataset provided.
Example
Given the dataset, verify the values of the slopes of the equation.
A linear equation describing the change in the number of high school students who smoke, in a group of [latex]100[/latex], between [latex]2011[/latex] and [latex]2015[/latex] is given as:
[latex]y = -1.75x+16[/latex]
And is based on the data from this table, provided by the Centers for Disease Control.
[latex]x[/latex] = the number of years since [latex]2011[/latex], and [latex]y[/latex] = the number of high school smokers per [latex]100[/latex] students.
| Year | Number of High School Students Smoking Cigarettes (per 100) |
| [latex]0[/latex] | [latex]16[/latex] |
| [latex]4[/latex] | [latex]9[/latex] |
| Name | Ordered Pair | Coordinates |
|---|---|---|
| Point 1 | [latex](0, 16)[/latex] | [latex]\begin{array}{l}x_{1}=0\\y_{1}=16\end{array}[/latex] |
| Point 2 | [latex](4, 9)[/latex] | [latex]\begin{array}{l}x_{2}=4\\y_{2}=9\end{array}[/latex] |
[latex]\displaystyle m=\frac{{{y}_{2}}-{{y}_{1}}}{{{x}_{2}}-{{x}_{1}}}=\frac{{9-16}}{{4-0}} =\frac{{-7}}{{4}}=-1.75[/latex]
We have verified that the slope [latex]\displaystyle{m=-1.75}[/latex] matches the dataset provided.
Interpret the Slope of Linear Equation
Okay, now we have verified that data can provide us with the slope of a linear equation. So what? We can use this information to describe how something changes using words.
Example
Interpret the slope of each equation for house values using words.
Hawaii: [latex]y = 3966x+74,400[/latex]
Mississippi: [latex]y = 924x+25,200[/latex]
Interpret the Meaning of the Slope Given a Linear Equation—Median Home Values
Example
Interpret the slope of the line describing the change in the number of high school smokers using words.
Apply units to the formula for slope. The [latex]x[/latex] values represent years, and the y values represent the number of smokers. Remember that this dataset is per [latex]100[/latex] high school students.
[latex]\displaystyle m=\frac{{9-16}}{{2015-2011}} =\frac{{-7 \text{ smokers}}}{{4\text{ year}}}=-1.75\frac{\text{ smokers}}{\text{ year}}[/latex]
The slope of this linear equation is negative, so this tells us that there is a decrease in the number of high school age smokers each year.
The number of high schoolers that smoke decreases by [latex]1.75[/latex] per [latex]100[/latex] each year.
Interpret the Meaning of the Slope of a Linear Equation—Smokers
On the next page, we will see how to interpret the y-intercept of a linear equation, and make a prediction based on a linear equation.
Candela Citations
- Intepret the Meaning of the Slope Given a Linear Equation - Median Home Values. Authored by: Mathispower4u. Located at: https://youtu.be/JT0WX5KOkJ8. License: Public Domain: No Known Copyright
- Intepret the Meaning of the Slope of a Linear Equation - Smokers. Authored by: Mathispower4u. Located at: https://youtu.be/aHLw5FcMjdc. License: Public Domain: No Known Copyright
- Youth and Tobacco Use. Authored by: Centers for Disease Control and Prevention. Provided by: U.S. Department of Health and Human Services. Located at: http://www.cdc.gov/tobacco/data_statistics/fact_sheets/youth_data/tobacco_use/index.htm. License: Public Domain: No Known Copyright
- Historical Census of Housing Tables Home Values. Authored by: United States Census Bureau. Provided by: U.S. Dept. of Housing. Located at: https://www.census.gov/hhes/www/housing/census/historic/values.html. License: Public Domain: No Known Copyright
