You can click on the following link to download the problem set for this module: Fiscal Policy Problem Set.
Fiscal Policy Problem Set[1]
1. Suppose that the amount of taxes in the US is equal to 1400. Suppose that the government expenditures are equal to 1400 (All numbers in billions of domestic currency)
Given this data, what can you say about the US’s budget (select one)?
- In the US they have a Balanced Budget.
- In the US they have a Budget Deficit
- In the US they have a Budget Surplus
2. Suppose that the amount of taxes in the US is equal to 1400. Suppose that the government expenditures are equal to 1400 (All numbers in billions of domestic currency)
Given this data, what will happen to the US’s national debt (select one)??
- National Debt will remain the same.
- National Debt will Decrease.
- National Debt will Increase.
3. Suppose that the amount of taxes in the US is equal to $1,600.
Suppose that the government expenditures is equal to $2,000.
In addition, you know that the current level of debt in the US is equal to $240,000.
(All numbers in billions of domestic currency.)
Given this data, what is the new level of the US’s debt?
4. Consider the following tax brackets in the US.
| Lower tax bracket | Upper tax bracket | Tax rate (%) |
| 0 | $24,999 | 9 |
| $25,000 | $49,999 | 10 |
| $50,000 | $74,999 | 11 |
| $75,000 | or higher | 12 |
Given this data, what type of taxes do they have in the US (select one)??
- Proportional or Flat Taxes
- Progressive Taxes
- Regressive Taxes
5. Consider the following tax brackets in the US.
| Lower tax bracket | Upper tax bracket | Tax rate (%) |
| 0 | $24,999 | 37 |
| $25,000 | $49,999 | 36 |
| $50,000 | $74,999 | 35 |
| $75,000 | or higher | 34 |
Suppose that a person earns $91,501
Given this data, what is this person’s marginal tax rate?
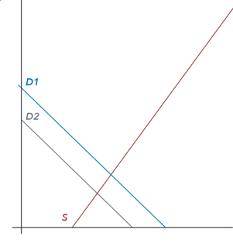
6. Consider the supply and demand diagrams for the financial market with interest rates on the vertical axis and quantity of financial capital on the horizontal axis.
Suppose that the government runs a significant budget deficit.
Which graph would most accurately predict the changes observed in the financial market as a result of this budget deficit?
Note that the new curve is shown in gray.
- S curve shifts left:

- S curve shifts right:

- D curve shifts right:
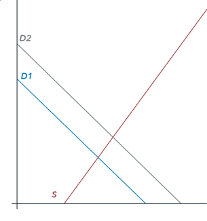
- D curve shifts left:
- The graph below shows the AD-AS diagram for the US.

What type of the GDP gap is observed in the US (select one)??
- There is no recessionary or inflationary gap.
- The economy is facing an inflationary gap.
- The Economy is facing a recessionary gap.
- The graph below shows the AD-AS diagram for the US.

What type of fiscal policy should the government of the US be implementing to bring the economy to the long-run equilibrium (select one)??
- There is no need for either contractionary or expansionary fiscal policy.
- The government should implement contractionary fiscal policy.
- The government should implement expansionary fiscal policy.
- The graph below shows the AD-AS diagram for the US.

Suppose that the government expenditure multiplier is equal to 6.
By how much should the government increase government expenditures (G) in order to close this recessionary gap?
- The graph below shows the AD-AS diagram for the US.
How big is the inflationary gap?
- The graph below shows the AD-AS diagram for the US.
Suppose that the government expenditure multiplier is equal to 6.
By how much should the government decrease government expenditures (G) in order to close this inflationary gap?
[1] This assignment by Lumen Learning is licensed under a Creative Commons Attribution 4.0 International License. You can access an alternative means to plotting points at https://www.desmos.com/calculator.
Candela Citations
- Problem Set Assignment: Fiscal Policy . Provided by: Lumen Learning. License: CC BY: Attribution