You can click on the following link to download the problem set for this module: Money and Banking Problem Set.
Money and Banking Problem Set[1]
Use the following information to answer questions 1 and 2:
Consider the following statistics for the banking sector in Canada displayed in the table below (all numbers in billions of domestic currency).
| Category | Amount (in billions of domestic currency) |
| Coins and Currency in Circulation | 1100 |
| Checkable Deposits | 1 |
| Traveler’s Checks | 1500 |
| Savings Accounts | 8200 |
| Money Market Mutual Funds | 1 |
| Time Deposits | 800 |
- Using the data above, calculate M1 for Canada.
- Using the data above, calculate M2 for Canada.
- Consider the following balance sheet for TD.
| Assets | Liabilities | ||
| Reserves | 136 | Deposits | 800 |
| Loans | 664 |
Suppose that TD lends out all the money allowed. Given this data, what is the required reserve ratio (in percentage terms)?
Use the following information to answer questions 4 through 6:
Consider the following balance sheet for TD.
| Assets | Liabilities | ||
| Reserves | 493 | Deposits | 2900 |
| Loans | 2407 |
- Suppose that TD is a typical bank and keeps only the required reserves. Given this data, what is the money multiplier?
- Suppose that TD is a typical bank and keeps only the required reserves. In addition, suppose that someone deposited $700.
Given this data, what is the total change in the M1 Money Supply?
- Suppose that someone deposited $700 at TD Bank.
Given this data, what is the minimum amount by which the money supply will increase?
- The graph below shows the supply and demand curves in the market for credit card borrowing.

What is the equilibrium interest rate?
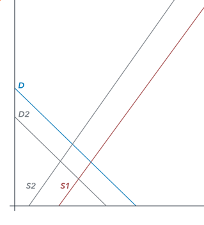
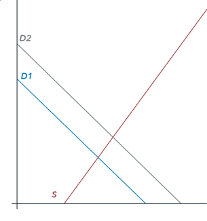
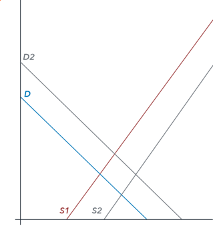
- Suppose that individuals shift their intertemporal consumption-savings decisions and decide to buy more things now. Which graph most accurately shows how this would affect demand and supply for borrowing money with credit cards? Note that the new curve is shown in gray.
- Supply and Demand curves shift left:
- Demand curve shifts right:
- Supply and Demand curve shift right:
- Demand curve shifts right and supply curve shifts left:

- Supply and Demand curves shift left:

- Suppose that consumers have a major change in their consumption/savings preferences. As a result of a serious recession they decide to consume less and save more. Which graph most accurately shows how this would affect demand and supply for borrowing money with credit cards? Note that the new curves are shown in gray.
- Supply and Demand curves shift left:
- Demand curve shifts right:
- Supply and Demand curve shift right:
- Supply shifts right and demand curve shifts left:

- Supply and Demand curves shift left:

- Suppose that TD Bank holds $2900 million in deposits and maintains a reserve ratio of 17%.
What is the amount of TD’s reserves?
- Suppose that TD Bank holds $2900 million in deposits and maintains a reserve ratio of 5%.
Given that TD Bank’s assets include only reserves and loans, what is the amount of TD Bank’s loans?
[1] This assignment by Lumen Learning is licensed under a Creative Commons Attribution 4.0 International License. You can access an alternative means to plotting points at https://www.desmos.com/calculator.
Candela Citations
CC licensed content, Original
- Problem Set Assignment: Money and Banking. Provided by: Lumen Learning. License: CC BY: Attribution