Learning Objectives
- Explain demand and the law of demand
- Identify and explain a demand curve
- Create and interpret a demand curve using a data set

Figure 1. Demand for Gas. If the price of gasoline suddenly increases dramatically, fewer people will take to the roads. This is explained by the law of demand.
Demand for Goods and Services
Economists use the term demand to refer to the amount of some good or service consumers are willing and able to purchase at each price. Demand is based on needs and wants—a consumer may be able to differentiate between a need and a want, but from an economist’s perspective, they are the same thing. Demand is also based on ability to pay. If you can’t pay for it, you have no effective demand.
What a buyer pays for a unit of the specific good or service is called the price. The total number of units purchased at that price is called the quantity demanded. A rise in the price of a good or service almost always decreases the quantity of that good or service demanded. Conversely, a fall in price will increase the quantity demanded. When the price of a gallon of gasoline goes up, for example, people look for ways to reduce their consumption by combining several errands, commuting by carpool or mass transit, or taking weekend or vacation trips closer to home. Economists call this inverse relationship between price and quantity demanded the law of demand. The law of demand assumes that all other variables that affect demand are held constant.
An example from the market for gasoline can be shown in the form of a table or a graph. A table that shows the quantity demanded at each price, such as Table 1, is called a demand schedule. Price in this case is measured in dollars per gallon of gasoline. The quantity demanded is measured in millions of gallons over some time period (for example, per day or per year) and over some geographic area (like a state or a country).
| Table 1. Price and Quantity Demanded of Gasoline | |
|---|---|
| Price (per gallon) | Quantity Demanded (millions of gallons) |
| $1.00 | 800 |
| $1.20 | 700 |
| $1.40 | 600 |
| $1.60 | 550 |
| $1.80 | 500 |
| $2.00 | 460 |
| $2.20 | 420 |
A demand curve shows the relationship between price and quantity demanded on a graph like Figure 2, below, with price per gallon on the vertical axis and quantity on the horizontal axis. Note that this is an exception to the normal rule in mathematics that the independent variable (x) goes on the horizontal axis and the dependent variable (y) goes on the vertical. Economics is different from math! Note also that each point on the demand curve comes from one row in Table 1. For example, the upper most point on the demand curve corresponds to the last row in Table 1, while the lower most point corresponds to the first row.
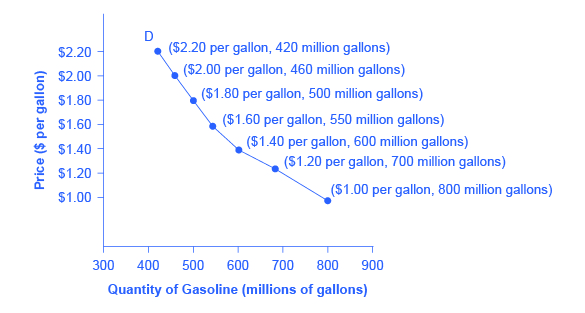
Figure 2. A Demand Curve for Gasoline (derived from the data in Table 1).
The demand schedule (Table 1) shows that as price rises, quantity demanded decreases, and vice versa. These points can then be graphed, and the line connecting them is the demand curve (shown by line D in the graph, above). The downward slope of the demand curve again illustrates the law of demand—the inverse relationship between prices and quantity demanded.
The demand schedule shown by Table 1 and the demand curve shown by the graph in Figure 2 are two ways of describing the same relationship between price and quantity demanded.
Try It
Watch It
The demand curve shows how much of a good people are willing to buy at different prices. Watch this video to see an example of the demand for oil. When oil prices are high, fewer people are willing to pay the hefty price tag but some consumers, like airliners, depend so heavily on using oil for fuel, they are willing to pay a lot. Other low-value consumers will be less likely to pay for expensive oil, as they could find substitutes or alternatives.
Demand curves will look somewhat different for each product. They may appear relatively steep or flat, or they may be straight or curved. Nearly all demand curves share the fundamental similarity that they slope down from left to right. In this way, demand curves embody the law of demand: As the price increases, the quantity demanded decreases, and conversely, as the price decreases, the quantity demanded increases.
Try It
Demand vs. Quantity Demanded
In economic terminology, demand is not the same as quantity demanded. When economists talk about demand, they mean the relationship between a range of prices and the quantities demanded at those prices, as illustrated by a demand curve or a demand schedule. When economists talk about quantity demanded, they mean only a certain point on the demand curve, or one quantity on the demand schedule. In short, demand refers to the curve and quantity demanded refers to the (specific) point on the curve.
What Factors Affect Demand?
We defined demand as the amount of some product that a consumer is willing and able to purchase at each price. This suggests at least two factors, in addition to price, that affect demand. “Willingness to purchase” suggests a desire to buy, and it depends on what economists call tastes and preferences. If you neither need nor want something, you won’t be willing to buy it. “Ability to purchase” suggests that income is important. Professors are usually able to afford better housing and transportation than students, because they have more income. The prices of related goods can also affect demand. If you need a new car, for example, the price of a Honda may affect your demand for a Ford. Finally, the size or composition of the population can affect demand. The more children a family has, the greater their demand for clothing. The more driving-age children a family has, the greater their demand for car insurance and the less for diapers and baby formula.
These factors matter both for demand by an individual and demand by the market as a whole. Exactly how do these various factors affect demand, and how do we show the effects graphically? To answer those questions, we need the ceteris paribus assumption.
Ceteris Paribus Assumption
A demand curve or a supply curve (which we’ll cover later in this module) is a relationship between two, and only two, variables: price on the vertical axis and quantity on the horizontal axis. The assumption behind a demand curve or a supply curve is that no relevant economic factors, other than the product’s price, are changing. Economists call this assumption ceteris paribus, a Latin phrase meaning “other things being equal.” Any given demand or supply curve is based on the ceteris paribus assumption that all else is held equal. Therefore, a demand curve or a supply curve is a relationship between two, and only two, variables when all other variables are held equal. If all else is not held equal, then the laws of supply and demand will not necessarily hold.
Try It
WHEN DOES CETERIS PARIBUS APPLY?
Ceteris paribus is applied when we look at how changes in price affect demand or supply, but ceteris paribus can also be applied more generally. In the real world, demand and supply depend on more factors than just price. For example, a consumer’s demand depends on income, and a producer’s supply depends on the cost of producing the product. How can we analyze the effect on demand or supply if multiple factors are changing at the same time—say price rises and income falls? The answer is that we examine the changes one at a time, and assume that the other factors are held constant.
For example, we can say that an increase in the price reduces the amount consumers will buy (assuming income, and anything else that affects demand, is unchanged). Additionally, a decrease in income reduces the amount consumers can afford to buy (assuming price, and anything else that affects demand, is unchanged). This is what the ceteris paribus assumption really means. In this particular case, after we analyze each factor separately, we can combine the results. The amount consumers buy falls for two reasons: first because of the higher price and second because of the lower income.
Watch It
Watch this video to review the theory of demand. Remember that, according to the law of demand and all other things being equal (ceteris paribus):
- the lower the price of a product, the more of it will be bought
- the higher the price of a product, the less of it will be bought
Glossary
- ceteris paribus:
- When changing one variable in a function (e.g. demand for some product), we assume everything else held constant
- demand:
- the relationship between the price of a certain good or service and the quantity of that good or service someone is willing and able to buy
- demand curve:
- a graphic representation of the relationship between price and quantity demanded of a certain good or service, with price on the vertical axis and quantity on the horizontal axis
- demand schedule:
- a table that shows the quantity demanded for a certain good or service at a range of prices
- law of demand:
- the common relationship that a higher price leads to a lower quantity demanded of a certain good or service and a lower price leads to a higher quantity demanded, while all other variables are held constant
- price:
- what a buyer pays for a unit of the specific good or service
- quantity demanded:
- the total number of units of a good or service consumers wish to purchase at a given price
Candela Citations
- Revision and adaptation. Provided by: Lumen Learning. License: CC BY: Attribution
- Demand, Supply, and Equilibrium in Markets for Goods and Services. Authored by: OpenStax College. Located at: https://cnx.org/contents/vEmOH-_p@4.44:gC7PkrST@7/Demand-Supply-and-Equilibrium-. License: CC BY: Attribution. License Terms: Download for free at http://cnx.org/contents/bc498e1f-efe9-43a0-8dea-d3569ad09a82@4.44
- gas station. Authored by: Falkenpost . Provided by: Pixabay. Located at: https://pixabay.com/en/petrol-stations-workshop-garage-old-1664553/. License: CC0: No Rights Reserved
- Episode 11: The Law of Demand. Authored by: Dr. Mary J. McGlasson. Located at: https://www.youtube.com/watch?v=uXlZIn6W7Ew. License: CC BY-NC-ND: Attribution-NonCommercial-NoDerivatives
- Episode 12: Change in Demand vs Change in Quantity Demanded. Authored by: Dr. Mary J. McGlasson. Located at: https://www.youtube.com/watch?v=aTSwcXJ700c. License: CC BY-NC-ND: Attribution-NonCommercial-NoDerivatives
- The Demand Curve. Provided by: Marginal Revolution University. Located at: https://www.youtube.com/watch?v=kUPm2tMCbGE&index=2&list=PL-uRhZ_p-BM4XnKSe3BJa23-XKJs_k4KY. License: Other. License Terms: Standard YouTube License