Learning outcomes
- Determine the winner of an election using preference ballots
- Evaluate the fairness of an election using preference ballots
- Determine the winner of an election using the Instant Runoff method
- Evaluate the fairness of and Instant Runoff election
- Determine the winner of an election using a Borda count
- Evaluate the fairness of an election determined using a Borda count
- Determine the winner of an election using Copeland’s method
- Evaluate the fairness of an election determined by Copeland’s method
In many decision making situations, it is necessary to gather the group consensus. This happens when a group of friends decides which movie to watch, when a company decides which product design to manufacture, and when a democratic country elects its leaders.
While the basic idea of voting is fairly universal, the method by which those votes are used to determine a winner can vary. Amongst a group of friends, you may decide upon a movie by voting for all the movies you’re willing to watch, with the winner being the one with the greatest approval. A company might eliminate unpopular designs then revote on the remaining. A country might look for the candidate with the most votes.
In deciding upon a winner, there is always one main goal: to reflect the preferences of the people in the most fair way possible.
In this lesson, we will study Preference Schedules and Preference Ballots as a means of deciding upon the winner of an election. A preference ballot is a ballot in which the voter ranks the choices in order of preference.
Plurality Method
Preference Schedules
To begin, we’re going to want more information than a traditional ballot normally provides. A traditional ballot usually asks you to pick your favorite from a list of choices. This ballot fails to provide any information on how a voter would rank the alternatives if their first choice was unsuccessful.
Preference ballot
A preference ballot is a ballot in which the voter ranks the choices in order of preference.
Example
A vacation club is trying to decide which destination to visit this year: Hawaii (H), Orlando (O), or Anaheim (A). Their votes are shown below:
| Bob | Ann | Marv | Alice | Eve | Omar | Lupe | Dave | Tish | Jim | |
| 1st choice | A | A | O | H | A | O | H | O | H | A |
| 2nd choice | O | H | H | A | H | H | A | H | A | H |
| 3rd choice | H | O | A | O | O | A | O | A | O | O |
These individual ballots are typically combined into one preference schedule, which shows the number of voters in the top row that voted for each option:
| 1 | 3 | 3 | 3 | |
| 1st choice | A | A | O | H |
| 2nd choice | O | H | H | A |
| 3rd choice | H | O | A | O |
Notice that by totaling the vote counts across the top of the preference schedule we can recover the total number of votes cast: [latex]1+3+3+3=10[/latex] total votes.
The following video will give you a summary of what issues can arise from elections, as well as how a preference table is used in elections.
Plurality
The voting method we’re most familiar with in the United States is the plurality method.
In this method, the choice with the most first-preference votes is declared the winner. Ties are possible, and would have to be settled through some sort of run-off vote.
This method is sometimes mistakenly called the majority method, or “majority rules”, but it is not necessary for a choice to have gained a majority of votes to win. A majority is over 50%; it is possible for a winner to have a plurality without having a majority.
Example
In our election from above, we had the preference table:
| 1 | 3 | 3 | 3 | |
| 1st choice | A | A | O | H |
| 2nd choice | O | H | H | A |
| 3rd choice | H | O | A | O |
For the plurality method, we only care about the first choice options. Totaling them up:
Anaheim: [latex]1+3=4[/latex] first-choice votes
Orlando: 3 first-choice votes
Hawaii: 3 first-choice votes
Anaheim is the winner using the plurality voting method.
Notice that Anaheim won with 4 out of 10 votes, 40% of the votes, which is a plurality of the votes, but not a majority.
Try It
Three candidates are running in an election for County Executive: Goings (G), McCarthy (M), and Bunney (B)[1] The voting schedule is shown below. Which candidate wins under the plurality method?
| 44 | 14 | 20 | 70 | 22 | 80 | 44 | |
| 1st choice | G | G | G | M | M | B | B |
| 2nd choice | M | B | G | B | M | ||
| 3rd choice | B | M | B | G | G |
Note: In the third column and last column, those voters only recorded a first-place vote, so we don’t know who their second and third choices would have been.
What’s Wrong with Plurality?
The election from the above example may seem totally clean, but there is a problem lurking that arises whenever there are three or more choices. Looking back at our preference table, how would our members vote if they only had two choices?
Anaheim vs Orlando: 7 out of the 10 would prefer Anaheim over Orlando
| 1 | 3 | 3 | 3 | |
| 1st choice | A | A | O | H |
| 2nd choice | O | H | H | A |
| 3rd choice | H | O | A | O |
Anaheim vs Hawaii: 6 out of 10 would prefer Hawaii over Anaheim
| 1 | 3 | 3 | 3 | |
| 1st choice | A | A | O | H |
| 2nd choice | O | H | H | A |
| 3rd choice | H | O | A | O |
This doesn’t seem right, does it? Anaheim just won the election, yet 6 out of 10 voters, 60% of them, would have preferred Hawaii! That hardly seems fair. Marquis de Condorcet, a French philosopher, mathematician, and political scientist wrote about how this could happen in 1785, and for him we name our first fairness criterion.
Fairness Criteria
The fairness criteria are statements that seem like they should be true in a fair election.
Condorcet Criterion
If there is a choice that is preferred in every one-to-one comparison with the other choices, that choice should be the winner. We call this winner the Condorcet Winner, or Condorcet Candidate.
Example
In the election, what choice is the Condorcet Winner?
We see above that Hawaii is preferred over Anaheim. Comparing Hawaii to Orlando, we can see 6 out of 10 would prefer Hawaii to Orlando.
| 1 | 3 | 3 | 3 | |
| 1st choice | A | A | O | H |
| 2nd choice | O | H | H | A |
| 3rd choice | H | O | A | O |
Since Hawaii is preferred in a one-to-one comparison to both other choices, Hawaii is the Condorcet Winner.
Example
Consider a city council election in a district that is historically 60% Democratic voters and 40% Republican voters. Even though city council is technically a nonpartisan office, people generally know the affiliations of the candidates. In this election there are three candidates: Don and Key, both Democrats, and Elle, a Republican. A preference schedule for the votes looks as follows:
| 342 | 214 | 298 | |
| 1st choice | Elle | Don | Key |
| 2nd choice | Don | Key | Don |
| 3rd choice | Key | Elle | Elle |
We can see a total of [latex]342+214+298=854[/latex] voters participated in this election. Computing percentage of first place votes:
Don: 214/854 = 25.1%
Key: 298/854 = 34.9%
Elle: 342/854 = 40.0%
So in this election, the Democratic voters split their vote over the two Democratic candidates, allowing the Republican candidate Elle to win under the plurality method with 40% of the vote.
Analyzing this election closer, we see that it violates the Condorcet Criterion. Analyzing the one-to-one comparisons:
Elle vs Don: 342 prefer Elle; 512 prefer Don: Don is preferred
Elle vs Key: 342 prefer Elle; 512 prefer Key: Key is preferred
Don vs Key: 556 prefer Don; 298 prefer Key: Don is preferred
So even though Don had the smallest number of first-place votes in the election, he is the Condorcet winner, being preferred in every one-to-one comparison with the other candidates.
If you prefer to watch a video of the previous example being worked out, here it is.
Try It
Consider the election from the previous Try It. Is there a Condorcet winner in this election?
| 44 | 14 | 20 | 70 | 22 | 80 | 44 | |
| 1st choice | G | G | G | M | M | B | B |
| 2nd choice | M | B | G | B | M | ||
| 3rd choice | B | M | B | G | G |
Insincere Voting
Situations when there are more than one candidate that share somewhat similar points of view, can lead to insincere voting. Insincere voting is when a person casts a ballot counter to their actual preference for strategic purposes. In the case above, the democratic leadership might realize that Don and Key will split the vote, and encourage voters to vote for Key by officially endorsing him. Not wanting to see their party lose the election, as happened in the scenario above, Don’s supporters might insincerely vote for Key, effectively voting against Elle.
The following video gives another mini lesson that covers the plurality method of voting as well as the idea of a Condorcet Winner.
Instant Runoff Voting
Instant Runoff Voting (IRV), also called Plurality with Elimination, is a modification of the plurality method that attempts to address the issue of insincere voting. In IRV, voting is done with preference ballots, and a preference schedule is generated. The choice with the least first-place votes is then eliminated from the election, and any votes for that candidate are redistributed to the voters’ next choice. This continues until a choice has a majority (over 50%).
This is similar to the idea of holding runoff elections, but since every voter’s order of preference is recorded on the ballot, the runoff can be computed without requiring a second costly election.
This voting method is used in several political elections around the world, including election of members of the Australian House of Representatives, and was used for county positions in Pierce County, Washington until it was eliminated by voters in 2009. A version of IRV is used by the International Olympic Committee to select host nations.
Example
Consider the preference schedule below, in which a company’s advertising team is voting on five different advertising slogans, called A, B, C, D, and E here for simplicity.
Initial votes
| 3 | 4 | 4 | 6 | 2 | 1 | |
| 1st choice | B | C | B | D | B | E |
| 2nd choice | C | A | D | C | E | A |
| 3rd choice | A | D | C | A | A | D |
| 4th choice | D | B | A | E | C | B |
| 5th choice | E | E | E | B | D | C |
If this was a plurality election, note that B would be the winner with 9 first-choice votes, compared to 6 for D, 4 for C, and 1 for E.
There are total of 3+4+4+6+2+1 = 20 votes. A majority would be 11 votes. No one yet has a majority, so we proceed to elimination rounds.
Round 1: We make our first elimination. Choice A has the fewest first-place votes, so we remove that choice
| 3 | 4 | 4 | 6 | 2 | 1 | |
| 1st choice | B | C | B | D | B | E |
| 2nd choice | C | D | C | E | ||
| 3rd choice | D | C | D | |||
| 4th choice | D | B | E | C | B | |
| 5th choice | E | E | E | B | D | C |
We then shift everyone’s choices up to fill the gaps. There is still no choice with a majority, so we eliminate again.
| 3 | 4 | 4 | 6 | 2 | 1 | |
| 1st choice | B | C | B | D | B | E |
| 2nd choice | C | D | D | C | E | D |
| 3rd choice | D | B | C | E | C | B |
| 4th choice | E | E | E | B | D | C |
Round 2: We make our second elimination. Choice E has the fewest first-place votes, so we remove that choice, shifting everyone’s options to fill the gaps.
| 3 | 4 | 4 | 6 | 2 | 1 | |
| 1st choice | B | C | B | D | B | D |
| 2nd choice | C | D | D | C | C | B |
| 3rd choice | D | B | C | B | D | C |
Notice that the first and fifth columns have the same preferences now, we can condense those down to one column.
| 5 | 4 | 4 | 6 | 1 | |
| 1st choice | B | C | B | D | D |
| 2nd choice | C | D | D | C | B |
| 3rd choice | D | B | C | B | C |
Now B has 9 first-choice votes, C has 4 votes, and D has 7 votes. Still no majority, so we eliminate again.
Round 3: We make our third elimination. C has the fewest votes.
| 5 | 4 | 4 | 6 | 1 | |
| 1st choice | B | D | B | D | D |
| 2nd choice | D | B | D | B | B |
Condensing this down:
| 9 | 11 | |
| 1st choice | B | D |
| 2nd choice | D | B |
D has now gained a majority, and is declared the winner under IRV.
The following video provides another view of the example from above.
Try It
Consider again this election. Find the winner using IRV.
| 44 | 14 | 20 | 70 | 22 | 80 | 39 | |
| 1st choice | G | G | G | M | M | B | B |
| 2nd choice | M | B | G | B | M | ||
| 3rd choice | B | M | B | G | G |
Here is an overview video that provides the definition of IRV, as well as an example of how to determine the winner of an election using IRV.
Please note: at 2:50 in the video it says 9+2+8=18, should 9+2+8=19, so D=19
What’s Wrong with IRV?
Example
Let’s return to our City Council Election.
| 342 | 214 | 298 | |
| 1st choice | Elle | Don | Key |
| 2nd choice | Don | Key | Don |
| 3rd choice | Key | Elle | Elle |
In this election, Don has the smallest number of first place votes, so Don is eliminated in the first round. The 214 people who voted for Don have their votes transferred to their second choice, Key.
| 342 | 512 | |
| 1st choice | Elle | Key |
| 2nd choice | Key | Elle |
So Key is the winner under the IRV method.
We can immediately notice that in this election, IRV violates the Condorcet Criterion, since we determined earlier that Don was the Condorcet winner. On the other hand, the temptation has been removed for Don’s supporters to vote for Key; they now know their vote will be transferred to Key, not simply discarded.
In the following video, we provide the example from above where we find that the IRV method violates the Condorcet Criterion in an election for a city council seat.
Example
Consider the voting system below.
| 37 | 22 | 12 | 29 | |
| 1st choice | Adams | Brown | Brown | Carter |
| 2nd choice | Brown | Carter | Adams | Adams |
| 3rd choice | Carter | Adams | Carter | Brown |
In this election, Carter would be eliminated in the first round, and Adams would be the winner with 66 votes to 34 for Brown.
Now suppose that the results were announced, but election officials accidentally destroyed the ballots before they could be certified, and the votes had to be recast. Wanting to “jump on the bandwagon,” 10 of the voters who had originally voted in the order Brown, Adams, Carter change their vote to favor the presumed winner, changing those votes to Adams, Brown, Carter.
| 47 | 22 | 2 | 29 | |
| 1st choice | Adams | Brown | Brown | Carter |
| 2nd choice | Brown | Carter | Adams | Adams |
| 3rd choice | Carter | Adams | Carter | Brown |
In this re-vote, Brown will be eliminated in the first round, having the fewest first-place votes. After transferring votes, we find that Carter will win this election with 51 votes to Adams’ 49 votes! Even though the only vote changes made favored Adams, the change ended up costing Adams the election. This doesn’t seem right, and introduces our second fairness criterion:
Monotonicity Criterion
If voters change their votes to increase the preference for a candidate, it should not harm that candidate’s chances of winning.
This criterion is violated by this election. Note that even though the criterion is violated in this particular election, it does not mean that IRV always violates the criterion; just that IRV has the potential to violate the criterion in certain elections.
The last video shows the example from above where the monotonicity criterion is violated.
Borda Count
Borda Count is another voting method, named for Jean-Charles de Borda, who developed the system in 1770.
Borda Count
In this method, points are assigned to candidates based on their ranking; 1 point for last choice, 2 points for second-to-last choice, and so on. The point values for all ballots are totaled, and the candidate with the largest point total is the winner.
Example
A group of mathematicians are getting together for a conference. The members are coming from four cities: Seattle, Tacoma, Puyallup, and Olympia. Their approximate locations on a map are shown below.
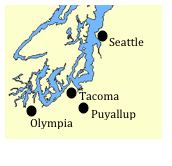
The votes for where to hold the conference were:
| 51 | 25 | 10 | 14 | |
| 1st choice | Seattle | Tacoma | Puyallup | Olympia |
| 2nd choice | Tacoma | Puyallup | Tacoma | Tacoma |
| 3rd choice | Olympia | Olympia | Olympia | Puyallup |
| 4th choice | Puyallup | Seattle | Seattle | Seattle |
Use the Borda count method to determine the winning town for the conference.
Here is a video showing the example from above.
Try It
Consider again the election from earlier. Find the winner using Borda Count. Since we have some incomplete preference ballots, for simplicity, give every unranked candidate 1 point, the points they would normally get for last place.
| 44 | 14 | 20 | 70 | 22 | 80 | 39 | |
| 1st choice | G | G | G | M | M | B | B |
| 2nd choice | M | B | G | B | M | ||
| 3rd choice | B | M | B | G | G |
What’s Wrong with Borda Count?
You might have already noticed one potential flaw of the Borda Count from the previous example. In that example, Seattle had a majority of first-choice votes, yet lost the election! This seems odd, and prompts our next fairness criterion:
Majority Criterion
If a choice has a majority of first-place votes, that choice should be the winner.
The election from the previous example using the Borda Count violates the Majority Criterion. Notice also that this automatically means that the Condorcet Criterion will also be violated, as Seattle would have been preferred by 51% of voters in any head-to-head comparison.
Borda count is sometimes described as a consensus-based voting system, since it can sometimes choose a more broadly acceptable option over the one with majority support. In the example above, Tacoma is probably the best compromise location. This is a different approach than plurality and instant runoff voting that focus on first-choice votes; Borda Count considers every voter’s entire ranking to determine the outcome.
Because of this consensus behavior, Borda Count, or some variation of it, is commonly used in awarding sports awards. Variations are used to determine the Most Valuable Player in baseball, to rank teams in NCAA sports, and to award the Heisman trophy.
Copeland’s Method
So far none of our voting methods have satisfied the Condorcet Criterion. The Copeland Method specifically attempts to satisfy the Condorcet Criterion by looking at pairwise (one-to-one) comparisons.
In this method, each pair of candidates is compared, using all preferences to determine which of the two is more preferred. The more preferred candidate is awarded 1 point. If there is a tie, each candidate is awarded ½ point. After all pairwise comparisons are made, the candidate with the most points, and hence the most pairwise wins, is declared the winner.
Variations of Copeland’s Method are used in many professional organizations, including election of the Board of Trustees for the Wikimedia Foundation that runs Wikipedia.
Example
Consider our vacation group example from the beginning of the chapter. Determine the winner using Copeland’s Method.
| 1 | 3 | 3 | 3 | |
| 1st choice | A | A | O | H |
| 2nd choice | O | H | H | A |
| 3rd choice | H | O | A | O |
Here is the same example presented in a video.
Example
Consider the advertising group’s vote we explored earlier. Determine the winner using Copeland’s method.
| 3 | 4 | 4 | 6 | 2 | 1 | |
| 1st choice | B | C | B | D | B | E |
| 2nd choice | C | A | D | C | E | A |
| 3rd choice | A | D | C | A | A | D |
| 4th choice | D | B | A | E | C | B |
| 5th choice | E | E | E | B | D | C |
Watch the same example from above being worked out in this video.
Try It
Consider again the election from earlier. Find the winner using Copeland’s method. Since we have some incomplete preference ballots, we’ll have to adjust. For example, when comparing M to B, we’ll ignore the 20 votes in the third column which do not rank either candidate.
| 44 | 14 | 20 | 70 | 22 | 80 | 39 | |
| 1st choice | G | G | G | M | M | B | B |
| 2nd choice | M | B | G | B | M | ||
| 3rd choice | B | M | B | G | G |
What’s Wrong with Copeland’s Method?
As already noted, Copeland’s Method does satisfy the Condorcet Criterion. It also satisfies the Majority Criterion and the Monotonicity Criterion. So is this the perfect method? Well, in a word, no.
Example
A committee is trying to award a scholarship to one of four students, Anna (A), Brian (B), Carlos (C), and Dimitry (D). The votes are shown below:
| 5 | 5 | 6 | 4 | |
| 1st choice | D | A | C | B |
| 2nd choice | A | C | B | D |
| 3rd choice | C | B | D | A |
| 4th choice | B | D | A | C |
Making the comparisons:
| A vs B: 10 votes to 10 votes | A gets ½ point, B gets ½ point |
| A vs C: 14 votes to 6 votes: | A gets 1 point |
| A vs D: 5 votes to 15 votes: | D gets 1 point |
| B vs C: 4 votes to 16 votes: | C gets 1 point |
| B vs D: 15 votes to 5 votes: | B gets 1 point |
| C vs D: 11 votes to 9 votes: | C gets 1 point |
Totaling:
| A has 1 ½ points | B has 1 ½ points |
| C has 2 points | D has 1 point |
So Carlos is awarded the scholarship. However, the committee then discovers that Dimitry was not eligible for the scholarship (he failed his last math class). Even though this seems like it shouldn’t affect the outcome, the committee decides to recount the vote, removing Dimitry from consideration. This reduces the preference schedule to:
| 5 | 5 | 6 | 4 | |
| 1st choice | A | A | C | B |
| 2nd choice | C | C | B | A |
| 3rd choice | B | B | A | C |
| A vs B: 10 votes to 10 votes | A gets ½ point, B gets ½ point |
| A vs C: 14 votes to 6 votes | A gets 1 point |
| B vs C: 4 votes to 16 votes | C gets 1 point |
Totaling:
| A has 1 ½ points | B has ½ point |
| C has 1 point |
Suddenly Anna is the winner! This leads us to another fairness criterion.
The Independence of Irrelevant Alternatives (IIA) Criterion
If a non-winning choice is removed from the ballot, it should not change the winner of the election.
Equivalently, if choice A is preferred over choice B, introducing or removing a choice C should not cause B to be preferred over A.
In the election from the last example, the IIA Criterion was violated.
Watch this video to see the example from above worked out again,
This anecdote illustrating the IIA issue is attributed to Sidney Morgenbesser:
After finishing dinner, Sidney Morgenbesser decides to order dessert. The waitress tells him he has two choices: apple pie and blueberry pie. Sidney orders the apple pie. After a few minutes the waitress returns and says that they also have cherry pie at which point Morgenbesser says “In that case I’ll have the blueberry pie.”
Another disadvantage of Copeland’s Method is that it is fairly easy for the election to end in a tie. For this reason, Copeland’s method is usually the first part of a more advanced method that uses more sophisticated methods for breaking ties and determining the winner when there is not a Condorcet Candidate.
So Where’s the Fair Method?
At this point, you’re probably asking why we keep looking at method after method just to point out that they are not fully fair. We must be holding out on the perfect method, right?
Unfortunately, no. A mathematical economist, Kenneth Arrow, was able to prove in 1949 that there is no voting method that will satisfy all the fairness criteria we have discussed.
Arrow’s Impossibility Theorem
Arrow’s Impossibility Theorem states, roughly, that it is not possible for a voting method to satisfy every fairness criteria that we’ve discussed.
To see a very simple example of how difficult voting can be, consider the election below:
| 5 | 5 | 5 | |
| 1st choice | A | C | B |
| 2nd choice | B | A | C |
| 3rd choice | C | B | A |
Notice that in this election:
10 people prefer A to B
10 people prefer B to C
10 people prefer C to A
No matter whom we choose as the winner, 2/3 of voters would prefer someone else! This scenario is dubbed Condorcet’s Voting Paradox, and demonstrates how voting preferences are not transitive (just because A is preferred over B, and B over C, does not mean A is preferred over C). In this election, there is no fair resolution.
It is because of this impossibility of a totally fair method that Plurality, IRV, Borda Count, Copeland’s Method, and dozens of variants are all still used. Usually the decision of which method to use is based on what seems most fair for the situation in which it is being applied.
Candela Citations
- Learning Objectives and Introduction. Provided by: Lumen Learning. License: CC BY: Attribution
- Revision and Adaptation. Provided by: Lumen Learning. License: CC BY: Attribution
- Which Method is Fair?. Authored by: Lumen Learning. License: CC BY: Attribution
- Voting Theory: Plurality Method and Condorcet Criterion. Authored by: Sousa, James (Mathispower4u.com). Located at: https://youtu.be/r-VmxJQFMq8. License: CC BY: Attribution
- Introduction to Voting Theory and Preference Tables. Authored by: Sousa, James (Mathispower4u.com). Located at: https://youtu.be/6rhpq1ozmuQ. License: CC BY: Attribution
- Condorcet winner and insincere voting with plurality method. Authored by: Lippman, David. Located at: https://youtu.be/x6DpoeaRVsw?list=PL1F887D3B8BF7C297. License: CC BY: Attribution
- Voting Theory: Instant Runoff Voting. Authored by: Sousa, James (Mathispower4u.com). Located at: https://youtu.be/6axH6pcuyhQ. License: CC BY: Attribution
- Instant Runoff Voting . Authored by: Lippman, David. Located at: https://youtu.be/C-X-6Lo_xUQ?list=PL1F887D3B8BF7C297. Project: Open Course Library. License: CC BY: Attribution
- Instant Runoff Voting 2 . Authored by: Lippman, David. Located at: https://youtu.be/BCRaYCU28Ro?list=PL1F887D3B8BF7C297. Project: Open Course Library. License: CC BY: Attribution
- IRV and Monotonicity . Authored by: Lippman, David. Located at: https://youtu.be/NH78zNXHKUs?list=PL1F887D3B8BF7C297. Project: Open Course Library. License: CC BY: Attribution
- Borda Count . Authored by: Lippman, David. Located at: https://youtu.be/vfujywLdW_s?list=PL1F887D3B8BF7C297. Project: Open Course Library. License: CC BY: Attribution
- Copeland's method / Pairwise comparison 1 . Located at: https://youtu.be/FftVPk7dqV0?list=PL1F887D3B8BF7C297. Project: Open Course Library. License: Public Domain: No Known Copyright
- Copeland's method / Pairwise comparsion 2 . Authored by: Lippman, David. Located at: https://youtu.be/sWdmkee5m_Q?list=PL1F887D3B8BF7C297. Project: Open Course Library. License: CC BY: Attribution
- Copelands and the IIA criterion . Authored by: Lippman, David. Located at: https://youtu.be/463jDBNR-qY?list=PL1F887D3B8BF7C297. Project: Open Course Library. License: CC BY: Attribution
- This data is loosely based on the 2008 County Executive election in Pierce County, Washington. See http://www.co.pierce.wa.us/xml/abtus/ourorg/aud/Elections/RCV/ranked/exec/summary.pdf ↵