Learning Outcomes
- Determine the area of a region between two curves by integrating with respect to the independent variable
- Find the area of a compound region
Area of a Region between Two Curves
Let [latex]f(x)[/latex] and [latex]g(x)[/latex] be continuous functions over an interval [latex]\left[a,b\right][/latex] such that [latex]f(x)\ge g(x)[/latex] on [latex]\left[a,b\right].[/latex] We want to find the area between the graphs of the functions, as shown in the following figure.
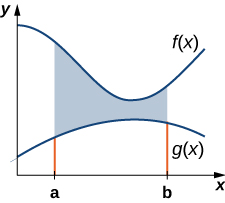
Figure 1. The area between the graphs of two functions, [latex]f(x)[/latex] and [latex]g(x),[/latex] on the interval [latex]\left[a,b\right].[/latex]
As we did before, we are going to partition the interval on the [latex]x\text{-axis}[/latex] and approximate the area between the graphs of the functions with rectangles. So, for [latex]i=0,1,2\text{,…},n,[/latex] let [latex]P=\left\{{x}_{i}\right\}[/latex] be a regular partition of [latex]\left[a,b\right].[/latex] Then, for [latex]i=1,2\text{,…},n,[/latex] choose a point [latex]{x}_{i}^{*}\in \left[{x}_{i-1},{x}_{i}\right],[/latex] and on each interval [latex]\left[{x}_{i-1},{x}_{i}\right][/latex] construct a rectangle that extends vertically from [latex]g({x}_{i}^{*})[/latex] to [latex]f({x}_{i}^{*}).[/latex] Figure 2(a) shows the rectangles when [latex]{x}_{i}^{*}[/latex] is selected to be the left endpoint of the interval and [latex]n=10.[/latex] Figure 2(b) shows a representative rectangle in detail.
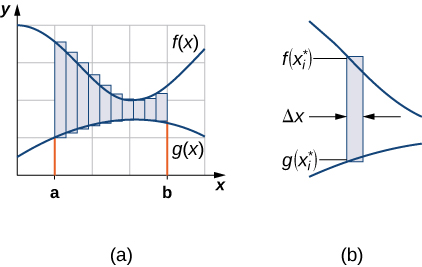
Figure 2. (a)We can approximate the area between the graphs of two functions, [latex]f(x)[/latex] and [latex]g(x),[/latex] with rectangles. (b) The area of a typical rectangle goes from one curve to the other.
The height of each individual rectangle is [latex]f({x}_{i}^{*})-g({x}_{i}^{*})[/latex] and the width of each rectangle is [latex]\text{Δ}x.[/latex] Adding the areas of all the rectangles, we see that the area between the curves is approximated by
This is a Riemann sum, so we take the limit as [latex]n\to \infty[/latex] and we get
These findings are summarized in the following theorem.
Finding the Area between Two Curves
Let [latex]f(x)[/latex] and [latex]g(x)[/latex] be continuous functions such that [latex]f(x)\ge g(x)[/latex] over an interval [latex]\left[a,b\right].[/latex] Let [latex]R[/latex] denote the region bounded above by the graph of [latex]f(x),[/latex] below by the graph of [latex]g(x),[/latex] and on the left and right by the lines [latex]x=a[/latex] and [latex]x=b,[/latex] respectively. Then, the area of [latex]R[/latex] is given by
We apply this theorem in the following example.
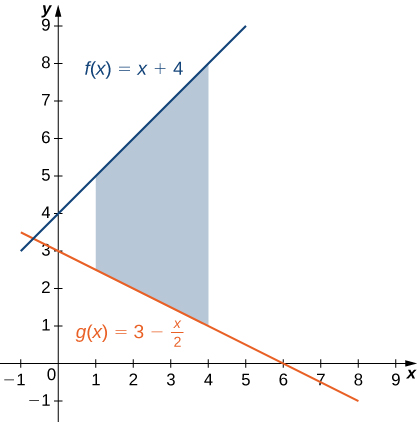
Example: Finding the Area of a Region between Two Curves 1
If R is the region bounded above by the graph of the function [latex]f(x)=x+4[/latex] and below by the graph of the function [latex]g(x)=3-\frac{x}{2}[/latex] over the interval [latex]\left[1,4\right],[/latex] find the area of region [latex]R.[/latex]
Try It
If [latex]R[/latex] is the region bounded by the graphs of the functions [latex]f(x)=\frac{x}{2}+5[/latex] and [latex]g(x)=x+\frac{1}{2}[/latex] over the interval [latex]\left[1,5\right],[/latex] find the area of region [latex]R.[/latex]
In the last example, we defined the interval of interest as part of the problem statement. Quite often, though, we want to define our interval of interest based on where the graphs of the two functions intersect. This is illustrated in the following example.
Example: Finding the Area of a Region between Two Curves 2
If [latex]R[/latex] is the region bounded above by the graph of the function [latex]f(x)=9-{(\frac{x}{2})}^{2}[/latex] and below by the graph of the function [latex]g(x)=6-x,[/latex] find the area of region [latex]R.[/latex]

Try It
If R is the region bounded above by the graph of the function [latex]f(x)=x[/latex] and below by the graph of the function [latex]g(x)={x}^{4},[/latex] find the area of region [latex]R.[/latex]
Watch the following video to see the worked solution to the above Try It.
Try It
Areas of Compound Regions
So far, we have required [latex]f(x)\ge g(x)[/latex] over the entire interval of interest, but what if we want to look at regions bounded by the graphs of functions that cross one another? In that case, we modify the process we just developed by using the absolute value function.
Finding the Area of a Region between Curves That Cross
Let [latex]f(x)[/latex] and [latex]g(x)[/latex] be continuous functions over an interval [latex]\left[a,b\right].[/latex] Let [latex]R[/latex] denote the region between the graphs of [latex]f(x)[/latex] and [latex]g(x),[/latex] and be bounded on the left and right by the lines [latex]x=a[/latex] and [latex]x=b,[/latex] respectively. Then, the area of [latex]R[/latex] is given by
In practice, applying this theorem requires us to break up the interval [latex]\left[a,b\right][/latex] and evaluate several integrals, depending on which of the function values is greater over a given part of the interval. We study this process in the following example.
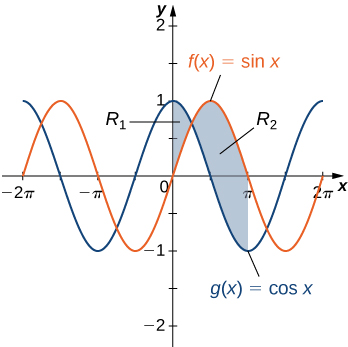
Example: Finding the Area of a Region Bounded by Functions That Cross
If R is the region between the graphs of the functions [latex]f(x)= \sin x[/latex] and [latex]g(x)= \cos x[/latex] over the interval [latex]\left[0,\pi \right],[/latex] find the area of region [latex]R.[/latex]
Try It
If R is the region between the graphs of the functions [latex]f(x)= \sin x[/latex] and [latex]g(x)= \cos x[/latex] over the interval [latex]\left[\frac{\pi}{2},2\pi \right],[/latex] find the area of region [latex]R.[/latex]
Watch the following video to see the worked solution to the above Try It.
Example: Finding the Area of a Complex Region
Consider the region depicted in Figure 6. Find the area of [latex]R.[/latex]
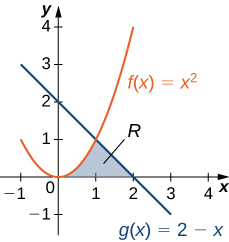
Figure 6. Two integrals are required to calculate the area of this region.
Try It
Consider the region depicted in the following figure. Find the area of [latex]R.[/latex]
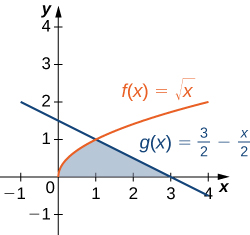
Figure 7.
Watch the following video to see the worked solution to the above Try It.
Candela Citations
- Calculus Volume 2. Authored by: Gilbert Strang, Edwin (Jed) Herman. Provided by: OpenStax. Located at: https://openstax.org/books/calculus-volume-2/pages/1-introduction. License: CC BY-NC-SA: Attribution-NonCommercial-ShareAlike. License Terms: Access for free at https://openstax.org/books/calculus-volume-2/pages/1-introduction