Find the volume of a solid of revolution using the disk method
Find the volume of a solid of revolution with a cavity using the washer method
The Disk Method
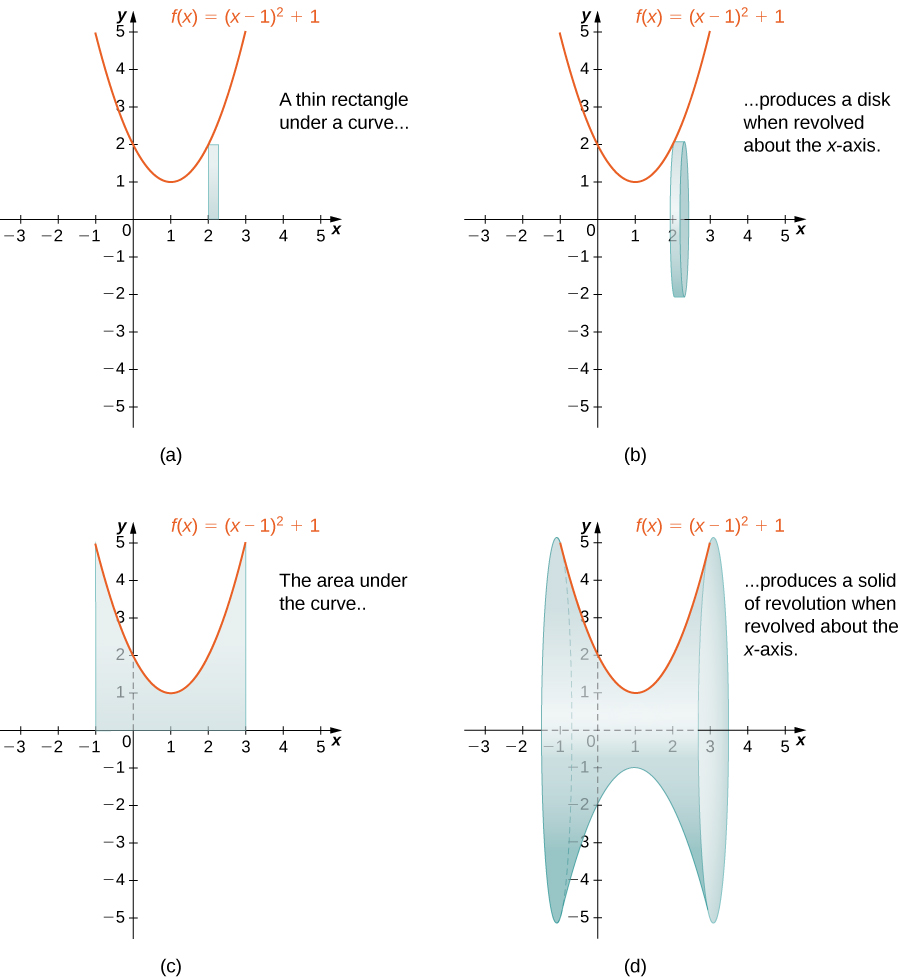
When we use the slicing method with solids of revolution, it is often called the disk method because, for solids of revolution, the slices used to over approximate the volume of the solid are disks. To see this, consider the solid of revolution generated by revolving the region between the graph of the function [latex]f(x)={(x-1)}^{2}+1[/latex] and the [latex]x\text{-axis}[/latex] over the interval [latex]\left[-1,3\right][/latex] around the [latex]x\text{-axis}\text{.}[/latex] The graph of the function and a representative disk are shown in Figure 9(a) and (b). The region of revolution and the resulting solid are shown in Figure 9(c) and (d).
Figure 9. (a) A thin rectangle for approximating the area under a curve. (b) A representative disk formed by revolving the rectangle about the [latex]x\text{-axis}\text{.}[/latex] (c) The region under the curve is revolved about the [latex]x\text{-axis},[/latex] resulting in (d) the solid of revolution.
We already used the formal Riemann sum development of the volume formula when we developed the slicing method. We know that
The only difference with the disk method is that we know the formula for the cross-sectional area ahead of time; it is the area of a circle. This gives the following rule.
The Disk Method
Let [latex]f(x)[/latex] be continuous and nonnegative. Define [latex]R[/latex] as the region bounded above by the graph of [latex]f(x),[/latex] below by the [latex]x\text{-axis,}[/latex] on the left by the line [latex]x=a,[/latex] and on the right by the line [latex]x=b.[/latex] Then, the volume of the solid of revolution formed by revolving [latex]R[/latex] around the [latex]x\text{-axis}[/latex] is given by
Example: Using the Disk Method to Find the Volume of a Solid of Revolution 1
Use the disk method to find the volume of the solid of revolution generated by rotating the region between the graph of [latex]f(x)=\sqrt{x}[/latex] and the [latex]x\text{-axis}[/latex] over the interval [latex]\left[1,4\right][/latex] around the [latex]x\text{-axis}\text{.}[/latex]
Show Solution
The graphs of the function and the solid of revolution are shown in the following figure.
Figure 10. (a) The function [latex]f(x)=\sqrt{x}[/latex] over the interval [latex]\left[1,4\right].[/latex] (b) The solid of revolution obtained by revolving the region under the graph of [latex]f(x)[/latex] about the [latex]x\text{-axis}.[/latex]
The volume is [latex]\frac{(15\pi )}{2}[/latex] units3.
Try It
Use the disk method to find the volume of the solid of revolution generated by rotating the region between the graph of [latex]f(x)=\sqrt{4-x}[/latex] and the [latex]x\text{-axis}[/latex] over the interval [latex]\left[0,4\right][/latex] around the [latex]x\text{-axis}\text{.}[/latex]
Show Solution
[latex]8\pi[/latex] units3
Watch the following video to see the worked solution to the above Try It.
Closed Captioning and Transcript Information for Video
For closed captioning, open the video on its original page by clicking the Youtube logo in the lower right-hand corner of the video display. In YouTube, the video will begin at the same starting point as this clip, but will continue playing until the very end.
So far, our examples have all concerned regions revolved around the [latex]x\text{-axis,}[/latex] but we can generate a solid of revolution by revolving a plane region around any horizontal or vertical line. In the next example, we look at a solid of revolution that has been generated by revolving a region around the [latex]y\text{-axis}\text{.}[/latex] The mechanics of the disk method are nearly the same as when the [latex]x\text{-axis}[/latex] is the axis of revolution, but we express the function in terms of [latex]y[/latex] and we integrate with respect to [latex]y[/latex] as well. This is summarized in the following rule.
The Disk Method for Solids of Revolution around the [latex]y[/latex]-axis
Let [latex]g(y)[/latex] be continuous and nonnegative. Define [latex]Q[/latex] as the region bounded on the right by the graph of [latex]g(y),[/latex] on the left by the [latex]y\text{-axis,}[/latex] below by the line [latex]y=c,[/latex] and above by the line [latex]y=d.[/latex] Then, the volume of the solid of revolution formed by revolving [latex]Q[/latex] around the [latex]y\text{-axis}[/latex] is given by
The next example shows how this rule works in practice.
example: Using the Disk Method to Find the Volume of a Solid of Revolution 2
Let [latex]R[/latex] be the region bounded by the graph of [latex]g(y)=\sqrt{4-y}[/latex] and the [latex]y\text{-axis}[/latex] over the [latex]y\text{-axis}[/latex] interval [latex]\left[0,4\right].[/latex] Use the disk method to find the volume of the solid of revolution generated by rotating [latex]R[/latex] around the [latex]y\text{-axis}\text{.}[/latex]
Show Solution
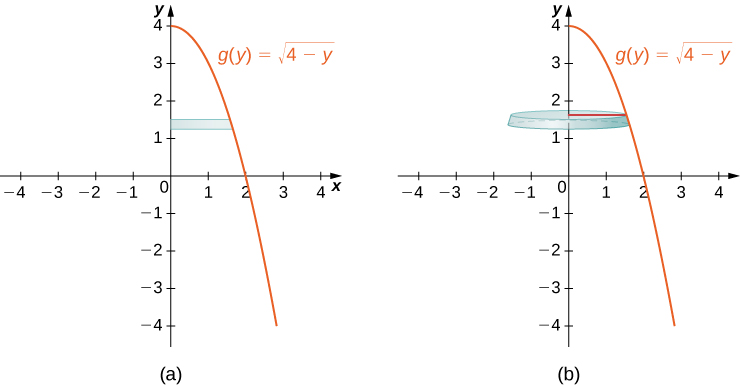
Figure 11 shows the function and a representative disk that can be used to estimate the volume. Notice that since we are revolving the function around the [latex]y\text{-axis,}[/latex] the disks are horizontal, rather than vertical.
Figure 11. (a) Shown is a thin rectangle between the curve of the function [latex]g(y)=\sqrt{4-y}[/latex] and the [latex]y\text{-axis}\text{.}[/latex] (b) The rectangle forms a representative disk after revolution around the [latex]y\text{-axis}\text{.}[/latex]
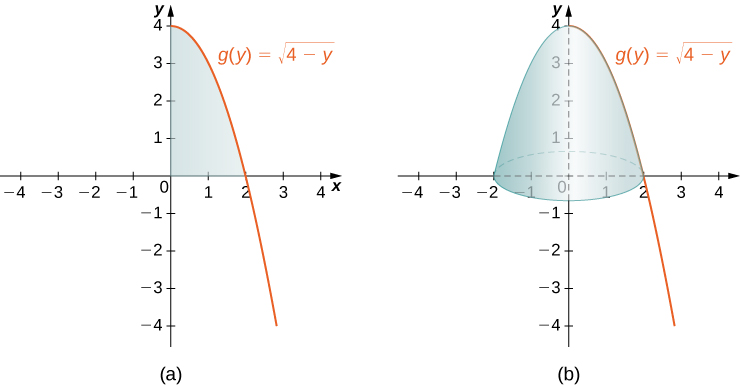
The region to be revolved and the full solid of revolution are depicted in the following figure.
Figure 12. (a) The region to the left of the function [latex]g(y)=\sqrt{4-y}[/latex] over the [latex]y\text{-axis}[/latex] interval [latex]\left[0,4\right].[/latex] (b) The solid of revolution formed by revolving the region about the [latex]y\text{-axis}\text{.}[/latex]
To find the volume, we integrate with respect to [latex]y.[/latex] We obtain
Use the disk method to find the volume of the solid of revolution generated by rotating the region between the graph of [latex]g(y)=y[/latex] and the [latex]y\text{-axis}[/latex] over the interval [latex]\left[1,4\right][/latex] around the [latex]y\text{-axis}\text{.}[/latex]
Hint
Use the procedure from the last example.
Show Solution
[latex]21\pi[/latex] units3
Try It
The Washer Method
Some solids of revolution have cavities in the middle; they are not solid all the way to the axis of revolution. Sometimes, this is just a result of the way the region of revolution is shaped with respect to the axis of revolution. In other cases, cavities arise when the region of revolution is defined as the region between the graphs of two functions. A third way this can happen is when an axis of revolution other than the [latex]x\text{-axis}[/latex] or [latex]y\text{-axis}[/latex] is selected.
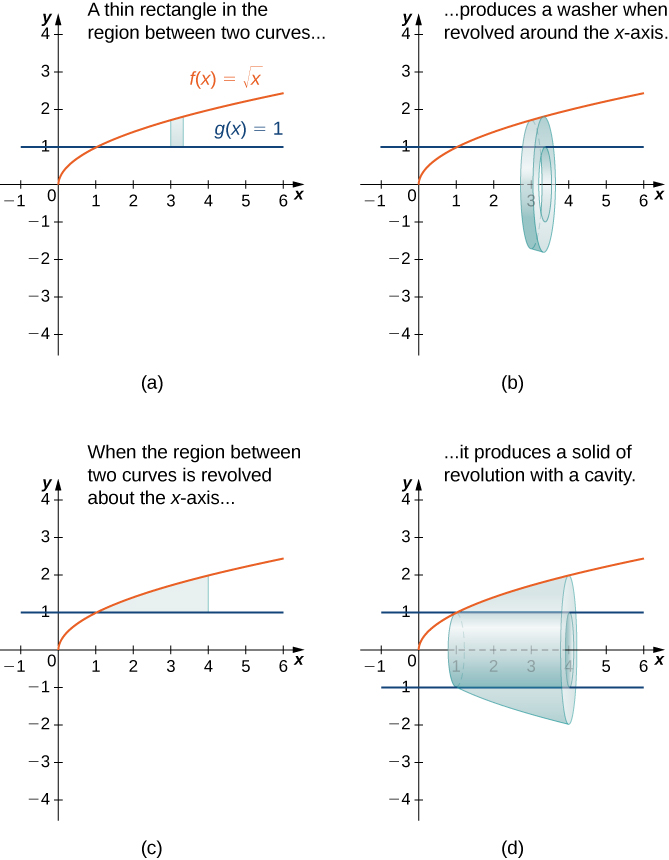
When the solid of revolution has a cavity in the middle, the slices used to approximate the volume are not disks, but washers (disks with holes in the center). For example, consider the region bounded above by the graph of the function [latex]f(x)=\sqrt{x}[/latex] and below by the graph of the function [latex]g(x)=1[/latex] over the interval [latex]\left[1,4\right].[/latex] When this region is revolved around the [latex]x\text{-axis,}[/latex] the result is a solid with a cavity in the middle, and the slices are washers. The graph of the function and a representative washer are shown in Figure 13(a) and (b). The region of revolution and the resulting solid are shown in Figure 13(c) and (d).
Figure 13. (a) A thin rectangle in the region between two curves. (b) A representative disk formed by revolving the rectangle about the [latex]x\text{-axis}.[/latex] (c) The region between the curves over the given interval. (d) The resulting solid of revolution.
The cross-sectional area, then, is the area of the outer circle less the area of the inner circle. In this case,
Generalizing this process gives the washer method.
The Washer Method
Suppose [latex]f(x)[/latex] and [latex]g(x)[/latex] are continuous, nonnegative functions such that [latex]f(x)\ge g(x)[/latex] over [latex]\left[a,b\right].[/latex] Let [latex]R[/latex] denote the region bounded above by the graph of [latex]f(x),[/latex] below by the graph of [latex]g(x),[/latex] on the left by the line [latex]x=a,[/latex] and on the right by the line [latex]x=b.[/latex] Then, the volume of the solid of revolution formed by revolving [latex]R[/latex] around the [latex]x\text{-axis}[/latex] is given by
Find the volume of a solid of revolution formed by revolving the region bounded above by the graph of [latex]f(x)=x[/latex] and below by the graph of [latex]g(x)=\frac{1}{x}[/latex] over the interval [latex]\left[1,4\right][/latex] around the [latex]x\text{-axis}\text{.}[/latex]
Show Solution
The graphs of the functions and the solid of revolution are shown in the following figure.
Figure 14. (a) The region between the graphs of the functions [latex]f(x)=x[/latex] and [latex]g(x)=\frac{1}{x}[/latex] over the interval [latex]\left[1,4\right].[/latex] (b) Revolving the region about the [latex]x\text{-axis}[/latex] generates a solid of revolution with a cavity in the middle.
Find the volume of a solid of revolution formed by revolving the region bounded by the graphs of [latex]f(x)=\sqrt{x}[/latex] and [latex]g(x)=\frac{1}{x}[/latex] over the interval [latex]\left[1,3\right][/latex] around the [latex]x\text{-axis}\text{.}[/latex]
Hint
Graph the functions to determine which graph forms the upper bound and which graph forms the lower bound, then use the procedure from the previous example.
Show Solution
[latex]\frac{10\pi }{3}[/latex] units3
Watch the following video to see the worked solution to the above Try It.
Closed Captioning and Transcript Information for Video
For closed captioning, open the video on its original page by clicking the Youtube logo in the lower right-hand corner of the video display. In YouTube, the video will begin at the same starting point as this clip, but will continue playing until the very end.
As with the disk method, we can also apply the washer method to solids of revolution that result from revolving a region around the [latex]y[/latex]-axis. In this case, the following rule applies.
The Washer Method for Solids of Revolution around the [latex]y[/latex]-axis
Suppose [latex]u(y)[/latex] and [latex]v(y)[/latex] are continuous, nonnegative functions such that [latex]v(y)\le u(y)[/latex] for [latex]y\in \left[c,d\right].[/latex] Let [latex]Q[/latex] denote the region bounded on the right by the graph of [latex]u(y),[/latex] on the left by the graph of [latex]v(y),[/latex] below by the line [latex]y=c,[/latex] and above by the line [latex]y=d.[/latex] Then, the volume of the solid of revolution formed by revolving [latex]Q[/latex] around the [latex]y\text{-axis}[/latex] is given by
Rather than looking at an example of the washer method with the [latex]y\text{-axis}[/latex] as the axis of revolution, we now consider an example in which the axis of revolution is a line other than one of the two coordinate axes. The same general method applies, but you may have to visualize just how to describe the cross-sectional area of the volume.
An important thing to remember is that for both the disk and washer method, the rectangles (the radii of the cross-sectional circles) are always perpendicular to the axis of revolution.
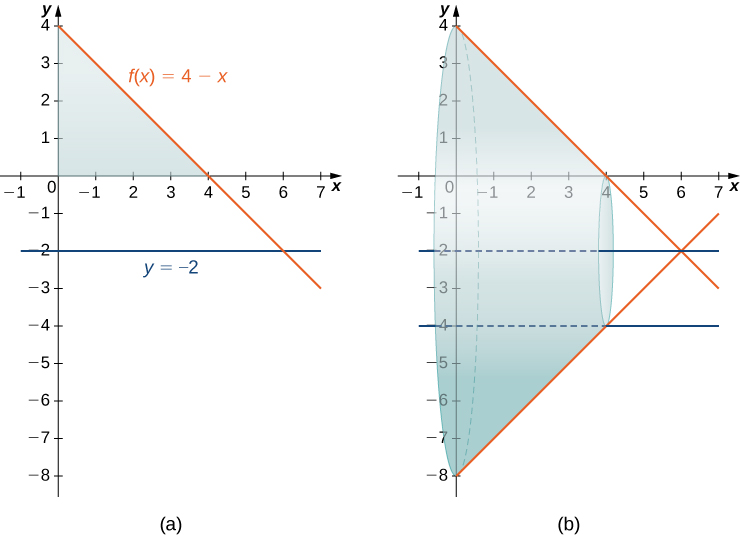
Example: The Washer Method with a Different Axis of Revolution
Find the volume of a solid of revolution formed by revolving the region bounded above by [latex]f(x)=4-x[/latex] and below by the [latex]x\text{-axis}[/latex] over the interval [latex]\left[0,4\right][/latex] around the line [latex]y=-2.[/latex]
Show Solution
The graph of the region and the solid of revolution are shown in the following figure.
Figure 15. (a) The region between the graph of the function [latex]f(x)=4-x[/latex] and the [latex]x\text{-axis}[/latex] over the interval [latex]\left[0,4\right].[/latex] (b) Revolving the region about the line [latex]y=-2[/latex] generates a solid of revolution with a cylindrical hole through its middle.
We can’t apply the volume formula to this problem directly because the axis of revolution is not one of the coordinate axes. However, we still know that the area of the cross-section is the area of the outer circle less the area of the inner circle. Looking at the graph of the function, we see the radius of the outer circle is given by [latex]f(x)+2,[/latex] which simplifies to
[latex]f(x)+2=(4-x)+2=6-x.[/latex]
The radius of the inner circle is [latex]g(x)=2.[/latex] Therefore, we have
Find the volume of a solid of revolution formed by revolving the region bounded above by the graph of [latex]f(x)=x+2[/latex] and below by the [latex]x\text{-axis}[/latex] over the interval [latex]\left[0,3\right][/latex] around the line [latex]y=-1.[/latex]
Hint
Use the procedure from the last example.
Show Solution
[latex]60\pi[/latex] units3
Candela Citations
CC licensed content, Original
2.2 Determining Volumes by Slicing. Authored by: Ryan Melton. License: CC BY: Attribution