Learning Outcomes
- Graph horizontal and vertical lines
- Graph linear equations in different forms using ordered pairs
- Graph a linear equation using x and y-intercepts
- Determine if and where two equations intersect
In the first three sections of Module 6, it is very important that we graph the equations we are given so there is a visual to assist us with setting up the needed integral. First, we will review the special equation forms for horizontal and vertical lines. Then, we will review how to graph equations using points and intercepts and determine where two functions intersect.
Graph Vertical and Horizontal Lines
The equation of a vertical line is given as
where c is a constant. The slope of a vertical line is undefined, and regardless of the y-value of any point on the line, the x-coordinate of the point will be c.
Suppose that we want to find the equation of a line containing the following points: [latex]\left(-3,-5\right),\left(-3,1\right),\left(-3,3\right)[/latex], and [latex]\left(-3,5\right)[/latex]. First, we will find the slope.
Zero in the denominator means that the slope is undefined and, therefore, we cannot use point-slope form. However, we can plot the points. Notice that all of the x-coordinates are the same and we find a vertical line through [latex]x=-3[/latex].
The equation of a horizontal line is given as
where c is a constant. The slope of a horizontal line is zero, and for any x-value of a point on the line, the y-coordinate will be c.
Suppose we want to find the equation of a line that contains the following set of points: [latex]\left(-2,-2\right),\left(0,-2\right),\left(3,-2\right)[/latex], and [latex]\left(5,-2\right)[/latex]. We can use point-slope form. First, we find the slope using any two points on the line.
Use any point for [latex]\left({x}_{1},{y}_{1}\right)[/latex] in the formula, or use the y-intercept.
The graph is a horizontal line through [latex]y=-2[/latex]. Notice that all of the y-coordinates are the same.
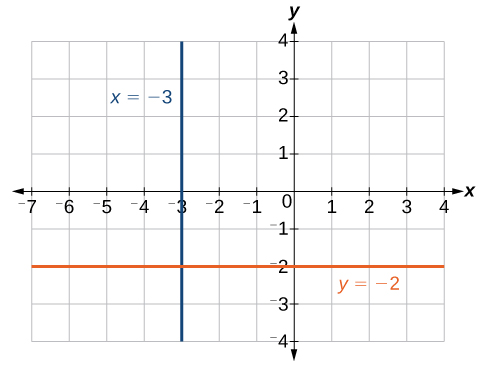
The line x = −3 is a vertical line. The line y = −2 is a horizontal line.
Example: Graphing Horizontal and Vertical Lines
Graph the line [latex]x=2[/latex].

Try It
Try It
Use Points to Graph Equations
We can plot a set of points to represent an equation. Suppose we want to graph the equation [latex]y=2x - 1[/latex]. We can begin by substituting a value for x into the equation and determining the resulting value of y. Each pair of x and y-values is an ordered pair that can be plotted. The table below lists values of x from –3 to 3 and the resulting values for y.
| [latex]x[/latex] | [latex]y=2x - 1[/latex] | [latex]\left(x,y\right)[/latex] |
| [latex]-3[/latex] | [latex]y=2\left(-3\right)-1=-7[/latex] | [latex]\left(-3,-7\right)[/latex] |
| [latex]-2[/latex] | [latex]y=2\left(-2\right)-1=-5[/latex] | [latex]\left(-2,-5\right)[/latex] |
| [latex]-1[/latex] | [latex]y=2\left(-1\right)-1=-3[/latex] | [latex]\left(-1,-3\right)[/latex] |
| [latex]0[/latex] | [latex]y=2\left(0\right)-1=-1[/latex] | [latex]\left(0,-1\right)[/latex] |
| [latex]1[/latex] | [latex]y=2\left(1\right)-1=1[/latex] | [latex]\left(1,1\right)[/latex] |
| [latex]2[/latex] | [latex]y=2\left(2\right)-1=3[/latex] | [latex]\left(2,3\right)[/latex] |
| [latex]3[/latex] | [latex]y=2\left(3\right)-1=5[/latex] | [latex]\left(3,5\right)[/latex] |
We can plot these points from the table. The points for this particular equation form a line, so we can connect them.

Note that the x-values chosen are arbitrary regardless of the type of equation we are graphing. Of course, some situations may require particular values of x to be plotted in order to see a particular result. Otherwise, it is logical to choose values that can be calculated easily, and it is always a good idea to choose values that are both negative and positive. There is no rule dictating how many points to plot, although we need at least two to graph a line. Keep in mind, however, that the more points we plot, the more accurately we can sketch the graph.
How To: Given an equation, graph by plotting points
- Make a table with one column labeled x, a second column labeled with the equation, and a third column listing the resulting ordered pairs.
- Enter x-values down the first column using positive and negative values. Selecting the x-values in numerical order will make graphing easier.
- Select x-values that will yield y-values with little effort, preferably ones that can be calculated mentally.
- Plot the ordered pairs.
- Connect the points if they form a line.
Example: Graphing an Equation in Two Variables by Plotting Points
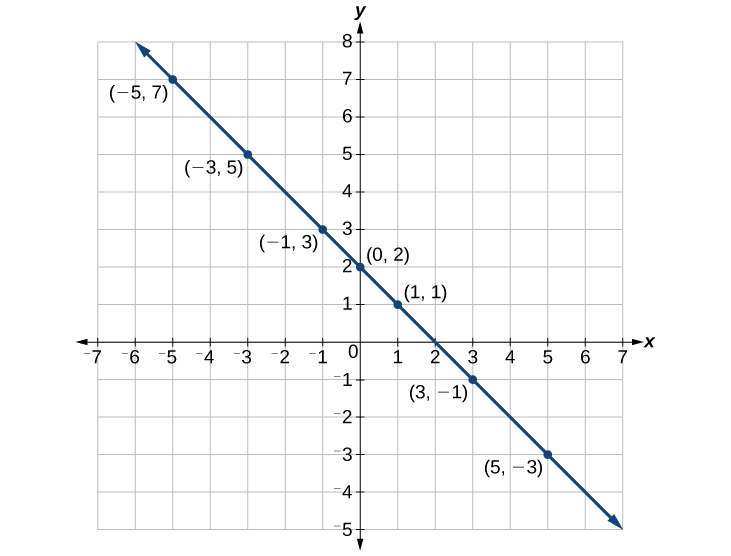
Graph the equation [latex]y=-x+2[/latex] by plotting points.
Try It
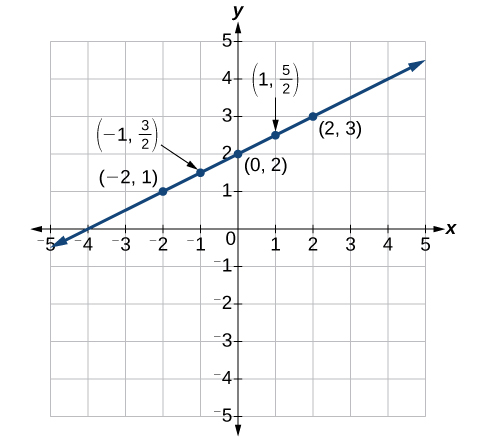
Construct a table and graph the equation by plotting points: [latex]y=\frac{1}{2}x+2[/latex].
Try It
Use Intercepts to Graph Equations
The intercepts of a graph are points where the graph crosses the axes. The x-intercept is the point where the graph crosses the x-axis. At this point, the y-coordinate is zero. The y-intercept is the point where the graph crosses the y-axis. At this point, the x-coordinate is zero.
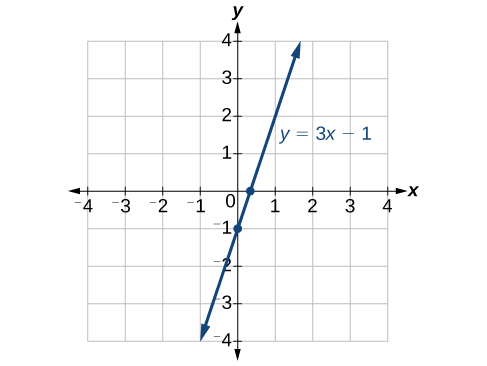
To determine the x-intercept, we set y equal to zero and solve for x. Similarly, to determine the y-intercept, we set x equal to zero and solve for y. For example, lets find the intercepts of the equation [latex]y=3x - 1[/latex].
To find the x-intercept, set [latex]y=0[/latex].
To find the y-intercept, set [latex]x=0[/latex].
We can confirm that our results make sense by observing a graph of the equation. Notice that the graph crosses the axes where we predicted it would.
How To: Given an equation, find the intercepts
- Find the x-intercept by setting [latex]y=0[/latex] and solving for [latex]x[/latex].
- Find the y-intercept by setting [latex]x=0[/latex] and solving for [latex]y[/latex].
Example: Finding the Intercepts of the Given Equation
Find the intercepts of the equation [latex]y=-3x - 4[/latex]. Then sketch the graph using only the intercepts.

Try It
Find the intercepts of the equation and sketch the graph: [latex]y=-\frac{3}{4}x+3[/latex].

Try It
Determine Where Two Functions Intersect
To determine where two functions intersect, set them equal to each other and solve for [latex]x[/latex].
Example: Determining Where Two Functions Intersect
Find the points of intersection of the functions [latex]y=x+2[/latex] and [latex]y=x^2+3x+2[/latex].

Try It
Find the points of intersection of the functions [latex]y=x-2[/latex] and [latex]y=2x^2-4x+1[/latex].
Candela Citations
- Modification and Revision . Provided by: Lumen Learning. License: CC BY: Attribution
- College Algebra Corequisite. Provided by: Lumen Learning. Located at: https://courses.lumenlearning.com/waymakercollegealgebracorequisite/. License: CC BY: Attribution
- Precalculus. Provided by: Lumen Learning. Located at: https://courses.lumenlearning.com/precalculus/. License: CC BY: Attribution