Learning Outcomes
- Write the equation of a line using slope and a point on the line
- Use symmetry to help locate the centroid of a thin plate.
In the Calculating Centers of Mass and Moments of Inertia section, we will explore how to calculate the center of mass and moment of inertia in two and three dimensions. Here we will review how to write the equation of a line and locate the center of mass of a lamina.
Write the Equation of a Line
(also in Module 1, Skills Review for Parametric Equations and Calculus of Parametric Equations)
The slope of a line refers to the ratio of the vertical change in y over the horizontal change in x between any two points on a line.
A General Note: The Slope of a Line
The slope of a line, m, represents the change in y over the change in x. Given two points, [latex]\left({x}_{1},{y}_{1}\right)[/latex] and [latex]\left({x}_{2},{y}_{2}\right)[/latex], the following formula determines the slope of a line containing these points:
Example: Finding the Slope of a Line Given Two Points
Find the slope of a line that passes through the points [latex]\left(2,-1\right)[/latex] and [latex]\left(-5,3\right)[/latex].
Try It
Find the slope of the line that passes through the points [latex]\left(-2,6\right)[/latex] and [latex]\left(1,4\right)[/latex].
To write the equation of a line, the line’s slope and a point the line goes through must be known. Perhaps the most familiar form of a linear equation is slope-intercept form written as [latex]y=mx+b[/latex], where [latex]m=\text{slope}[/latex] and [latex]b=y\text{-intercept}[/latex]. Let us begin with the slope.
Often, the starting point to writing the equation of a line is to use point-slope formula. Given the slope and one point on a line, we can find the equation of the line using point-slope form shown below.
We need only one point and the slope of the line to use the formula. After substituting the slope and the coordinates of one point into the formula, we simplify it and write it in slope-intercept form.
A General Note: The Point-Slope Formula
Given one point and the slope, using point-slope form will lead to the equation of a line:
Example: Finding the Equation of a Line Given the Slope and One Point
Write the equation of the line with slope [latex]m=-3[/latex] and passing through the point [latex]\left(4,8\right)[/latex]. Write the final equation in slope-intercept form.
Try It
Given [latex]m=4[/latex], find the equation of the line in slope-intercept form passing through the point [latex]\left(2,5\right)[/latex].
Try It
Center of Mass of Thin Plates
An object that is a two-dimensional “sheet” (such as paper) is called a lamina. A lamina is often represented by a two-dimensional region in a plane. Suppose we have a lamina bounded above by the graph of a continuous function [latex]f(x),[/latex] below by the [latex]x[/latex]-axis, and on the left and right by the lines [latex]x=a[/latex] and [latex]x=b,[/latex] respectively, as shown in the following figure.
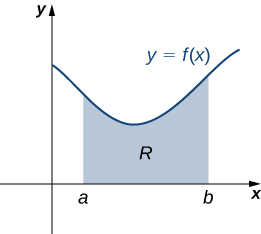
A region in the plane representing a lamina.
To find the center of mass of a lamina, we need to find the total mass of the lamina, as well as the moments of the lamina with respect to the [latex]x[/latex]– and [latex]y[/latex]-axes.
Center of Mass of a Thin Plate in the xy-Plane
Let R denote a region bounded above by the graph of a continuous function [latex]f(x),[/latex] below by the [latex]x[/latex]-axis, and on the left and right by the lines [latex]x=a[/latex] and [latex]x=b,[/latex] respectively. Let [latex]\rho[/latex] denote the density of the associated lamina. Then we can make the following statements:
- The mass of the lamina is
[latex]m=\rho {\displaystyle\int }_{a}^{b}f(x)dx.[/latex]
- The moments [latex]{M}_{x}[/latex] and [latex]{M}_{y}[/latex] of the lamina with respect to the [latex]x[/latex]– and [latex]y[/latex]-axes, respectively, are
[latex]{M}_{x}=\rho {\displaystyle\int }_{a}^{b}\frac{{\left[f(x)\right]}^{2}}{2}dx\text{ and }{M}_{y}=\rho {\displaystyle\int }_{a}^{b}xf(x)dx.[/latex]
- The coordinates of the center of mass [latex](\overline{x},\overline{y})[/latex] are
[latex]\overline{x}=\frac{{M}_{y}}{m}\text{ and }\overline{y}=\frac{{M}_{x}}{m}.[/latex]
Example: Finding the Center of Mass of a Lamina
Let R be the region bounded above by the graph of the function [latex]f(x)=\sqrt{x}[/latex] and below by the [latex]x[/latex]-axis over the interval [latex]\left[0,4\right].[/latex] Find the centroid (center of mass) of the region.

Try It
Let [latex]R[/latex] be the region bounded above by the graph of the function [latex]f(x)={x}^{2}[/latex] and below by the [latex]x[/latex]-axis over the interval [latex]\left[0,2\right].[/latex]. Find the centroid (center of mass) of the region.
We can adapt this approach to find centroids of more complex regions as well. Suppose our region is bounded above by the graph of a continuous function [latex]f(x),[/latex] as before, but now, instead of having the lower bound for the region be the [latex]x[/latex]-axis, suppose the region is bounded below by the graph of a second continuous function, [latex]g(x),[/latex] as shown in the following figure.
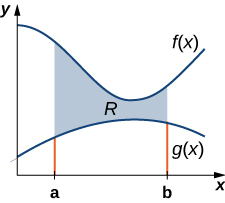
A region between two functions.
Again, we partition the interval [latex]\left[a,b\right][/latex] and construct rectangles. A representative rectangle is shown in the following figure.
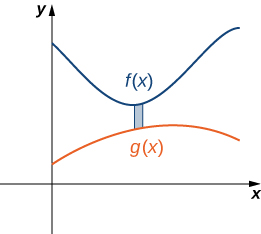
A representative rectangle of the region between two functions.
Center of Mass of a Lamina Bounded by Two Functions
Let R denote a region bounded above by the graph of a continuous function [latex]f(x),[/latex] below by the graph of the continuous function [latex]g(x),[/latex] and on the left and right by the lines [latex]x=a[/latex] and [latex]x=b,[/latex] respectively. Let [latex]\rho[/latex] denote the density of the associated lamina. Then we can make the following statements:
- The mass of the lamina is
[latex]m=\rho {\displaystyle\int }_{a}^{b}\left[f(x)-g(x)\right]dx.[/latex]
- The moments [latex]{M}_{x}[/latex] and [latex]{M}_{y}[/latex] of the lamina with respect to the [latex]x[/latex]– and [latex]y[/latex]-axes, respectively, are
[latex]{M}_{x}=\rho {\displaystyle\int }_{a}^{b}\frac{1}{2}({\left[f(x)\right]}^{2}-{\left[g(x)\right]}^{2})dx\text{ and }{M}_{y}=\rho {\displaystyle\int }_{a}^{b}x\left[f(x)-g(x)\right]dx.[/latex]
- The coordinates of the center of mass [latex](\overline{x},\overline{y})[/latex] are
[latex]\overline{x}=\frac{{M}_{y}}{m}\text{ and }\overline{y}=\frac{{M}_{x}}{m}.[/latex]
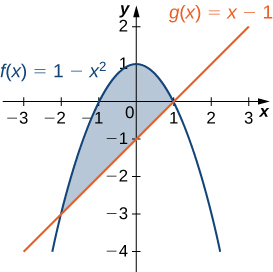
Example: Finding the Centroid of a Region Bounded by Two Functions
Let R be the region bounded above by the graph of the function [latex]f(x)=1-{x}^{2}[/latex] and below by the graph of the function [latex]g(x)=x-1.[/latex] Find the centroid of the region.
Try It
Let R be the region bounded above by the graph of the function [latex]f(x)=6-{x}^{2}[/latex] and below by the graph of the function [latex]g(x)=3-2x.[/latex] Find the centroid of the region.
Try It
Candela Citations
- Calculus Volume 1. Provided by: Lumen Learning. Located at: https://courses.lumenlearning.com/calculus1/. License: CC BY: Attribution
- Calculus Volume 2. Provided by: Lumen Learning. Located at: https://courses.lumenlearning.com/calculus2/. License: CC BY: Attribution