Learning Outcomes
- Write the equation of a circle in standard form
- Identify the equation of an ellipse in standard form with given foci
- Identify the equation of a hyperbola in standard form with given foci
- Identify the equation of a parabola in standard form with given focus and directrix
In the Quadric Surfaces section, we will look at the equations of common three-dimensional figures and their graphs. A big part of understanding the graph of a three-dimensional figure often relies on extending one’s understanding of two-dimensional figures. Here we will review the equation forms of circles, ellipse, hyperbolas, and parabolas.
Write the Equation of a Circle in Standard Form
(See Module 2, Skills Review for Vectors in Three Dimensions)
Ellipses
An ellipse is the set of all points [latex]\left(x,y\right)[/latex] in a plane such that the sum of their distances from two fixed points is a constant. Each fixed point is called a focus (plural: foci).
A General Note: Standard Forms of the Equation of an Ellipse with Center (0,0)
The standard form of the equation of an ellipse with center [latex]\left(0,0\right)[/latex] and major axis on the x-axis is
[latex]\frac{{x}^{2}}{{a}^{2}}+\frac{{y}^{2}}{{b}^{2}}=1[/latex]
where
- [latex]a>b[/latex]
- the length of the major axis is [latex]2a[/latex]
- the coordinates of the vertices are [latex]\left(\pm a,0\right)[/latex]
- the length of the minor axis is [latex]2b[/latex]
- the coordinates of the co-vertices are [latex]\left(0,\pm b\right)[/latex]
- the coordinates of the foci are [latex]\left(\pm c,0\right)[/latex] , where [latex]{c}^{2}={a}^{2}-{b}^{2}[/latex].
The standard form of the equation of an ellipse with center [latex]\left(0,0\right)[/latex] and major axis on the y-axis is
[latex]\frac{{x}^{2}}{{b}^{2}}+\frac{{y}^{2}}{{a}^{2}}=1[/latex]
where
- [latex]a>b[/latex]
- the length of the major axis is [latex]2a[/latex]
- the coordinates of the vertices are [latex]\left(0,\pm a\right)[/latex]
- the length of the minor axis is [latex]2b[/latex]
- the coordinates of the co-vertices are [latex]\left(\pm b,0\right)[/latex]
- the coordinates of the foci are [latex]\left(0,\pm c\right)[/latex] , where [latex]{c}^{2}={a}^{2}-{b}^{2}[/latex].
Note that the vertices, co-vertices, and foci are related by the equation [latex]{c}^{2}={a}^{2}-{b}^{2}[/latex]. When we are given the coordinates of the foci and vertices of an ellipse, we can use this relationship to find the equation of the ellipse in standard form.

(a) Horizontal ellipse with center [latex]\left(0,0\right)[/latex] (b) Vertical ellipse with center [latex]\left(0,0\right)[/latex]
We can graph an ellipse given its equation. To graph ellipses centered at the origin, we use the standard form [latex]\frac{{x}^{2}}{{a}^{2}}+\frac{{y}^{2}}{{b}^{2}}=1,\text{ }a>b[/latex] for horizontal ellipses and [latex]\frac{{x}^{2}}{{b}^{2}}+\frac{{y}^{2}}{{a}^{2}}=1,\text{ }a>b[/latex] for vertical ellipses.
How To: Given the standard form of an equation for an ellipse centered at [latex]\left(0,0\right)[/latex], sketch the graph.
- Use the standard forms of the equations of an ellipse to determine the major axis, vertices, co-vertices, and foci.
- If the equation is in the form [latex]\frac{{x}^{2}}{{a}^{2}}+\frac{{y}^{2}}{{b}^{2}}=1[/latex], where [latex]a>b[/latex], then
- the major axis is the [latex]x[/latex]-axis
- the coordinates of the vertices are [latex]\left(\pm a,0\right)[/latex]
- the coordinates of the co-vertices are [latex]\left(0,\pm b\right)[/latex]
- the coordinates of the foci are [latex]\left(\pm c,0\right)[/latex]
- If the equation is in the form [latex]\frac{{x}^{2}}{{b}^{2}}+\frac{{y}^{2}}{{a}^{2}}=1[/latex], where [latex]a>b[/latex], then
- the major axis is the [latex]y[/latex]-axis
- the coordinates of the vertices are [latex]\left(0,\pm a\right)[/latex]
- the coordinates of the co-vertices are [latex]\left(\pm b,0\right)[/latex]
- the coordinates of the foci are [latex]\left(0,\pm c\right)[/latex]
- If the equation is in the form [latex]\frac{{x}^{2}}{{a}^{2}}+\frac{{y}^{2}}{{b}^{2}}=1[/latex], where [latex]a>b[/latex], then
- Solve for [latex]c[/latex] using the equation [latex]{c}^{2}={a}^{2}-{b}^{2}[/latex].
- Plot the center, vertices, co-vertices, and foci in the coordinate plane, and draw a smooth curve to form the ellipse.
Example: Graphing an Ellipse Centered at the Origin
Graph the ellipse given by the equation, [latex]\frac{{x}^{2}}{9}+\frac{{y}^{2}}{25}=1[/latex]. Identify and label the center, vertices, co-vertices, and foci.

Try It
Graph the ellipse given by the equation [latex]\frac{{x}^{2}}{36}+\frac{{y}^{2}}{4}=1[/latex]. Identify and label the center, vertices, co-vertices, and foci.

Try It
When an ellipse is not centered at the origin, we can still use the standard forms to find the key features of the graph. When the ellipse is centered at some point, [latex]\left(h,k\right)[/latex], we use the standard forms [latex]\frac{{\left(x-h\right)}^{2}}{{a}^{2}}+\frac{{\left(y-k\right)}^{2}}{{b}^{2}}=1,\text{ }a>b[/latex] for horizontal ellipses and [latex]\frac{{\left(x-h\right)}^{2}}{{b}^{2}}+\frac{{\left(y-k\right)}^{2}}{{a}^{2}}=1,\text{ }a>b[/latex] for vertical ellipses. From these standard equations, we can easily determine the center, vertices, co-vertices, foci, and positions of the major and minor axes.
How To: Given the standard form of an equation for an ellipse centered at [latex]\left(h,k\right)[/latex], sketch the graph.
- Use the standard forms of the equations of an ellipse to determine the center, position of the major axis, vertices, co-vertices, and foci.
- If the equation is in the form [latex]\frac{{\left(x-h\right)}^{2}}{{a}^{2}}+\frac{{\left(y-k\right)}^{2}}{{b}^{2}}=1[/latex], where [latex]a>b[/latex], then
- the center is [latex]\left(h,k\right)[/latex]
- the major axis is parallel to the [latex]x[/latex]-axis
- the coordinates of the vertices are [latex]\left(h\pm a,k\right)[/latex]
- the coordinates of the co-vertices are [latex]\left(h,k\pm b\right)[/latex]
- the coordinates of the foci are [latex]\left(h\pm c,k\right)[/latex]
- If the equation is in the form [latex]\frac{{\left(x-h\right)}^{2}}{{b}^{2}}+\frac{{\left(y-k\right)}^{2}}{{a}^{2}}=1[/latex], where [latex]a>b[/latex], then
- the center is [latex]\left(h,k\right)[/latex]
- the major axis is parallel to the [latex]y[/latex]-axis
- the coordinates of the vertices are [latex]\left(h,k\pm a\right)[/latex]
- the coordinates of the co-vertices are [latex]\left(h\pm b,k\right)[/latex]
- the coordinates of the foci are [latex]\left(h,k\pm c\right)[/latex]
- If the equation is in the form [latex]\frac{{\left(x-h\right)}^{2}}{{a}^{2}}+\frac{{\left(y-k\right)}^{2}}{{b}^{2}}=1[/latex], where [latex]a>b[/latex], then
- Solve for [latex]c[/latex] using the equation [latex]{c}^{2}={a}^{2}-{b}^{2}[/latex].
- Plot the center, vertices, co-vertices, and foci in the coordinate plane, and draw a smooth curve to form the ellipse.
Example: Graphing an Ellipse Centered at the (H,K)
Graph the ellipse given by the equation, [latex]\frac{{\left(x+2\right)}^{2}}{4}+\frac{{\left(y - 5\right)}^{2}}{9}=1[/latex]. Identify and label the center, vertices, co-vertices, and foci.

Try It
Graph the ellipse given by the equation [latex]\frac{{\left(x - 4\right)}^{2}}{36}+\frac{{\left(y - 2\right)}^{2}}{20}=1[/latex]. Identify and label the center, vertices, co-vertices, and foci.

Try It
Hyperbolas
A hyperbola is a conic section formed by intersecting a right circular cone with a plane at an angle such that both halves of the cone are intersected. This intersection produces two separate unbounded curves that are mirror images of each other.

When we have an equation in standard form for a hyperbola centered at the origin, we can interpret its parts to identify the key features of its graph: the center, vertices, co-vertices, asymptotes, foci, and lengths and positions of the transverse and conjugate axes. To graph hyperbolas centered at the origin, we use the standard form [latex]\frac{{x}^{2}}{{a}^{2}}-\frac{{y}^{2}}{{b}^{2}}=1[/latex] for horizontal hyperbolas and the standard form [latex]\frac{{y}^{2}}{{a}^{2}}-\frac{{x}^{2}}{{b}^{2}}=1[/latex] for vertical hyperbolas.
How To: Given a standard form equation for a hyperbola centered at [latex]\left(0,0\right)[/latex], sketch the graph.
- Determine which of the standard forms applies to the given equation.
- Use the standard form identified in Step 1 to determine the position of the transverse axis; coordinates for the vertices, co-vertices, and foci; and the equations for the asymptotes.
- If the equation is in the form [latex]\frac{{x}^{2}}{{a}^{2}}-\frac{{y}^{2}}{{b}^{2}}=1[/latex], then
- the transverse axis is on the [latex]x[/latex] -axis
- the coordinates of the vertices are [latex]\left(\pm a,0\right)[/latex]
- the coordinates of the co-vertices are [latex]\left(0,\pm b\right)[/latex]
- the coordinates of the foci are [latex]\left(\pm c,0\right)[/latex]
- the equations of the asymptotes are [latex]y=\pm \frac{b}{a}x[/latex]
- If the equation is in the form [latex]\frac{{y}^{2}}{{a}^{2}}-\frac{{x}^{2}}{{b}^{2}}=1[/latex], then
- the transverse axis is on the [latex]y[/latex] -axis
- the coordinates of the vertices are [latex]\left(0,\pm a\right)[/latex]
- the coordinates of the co-vertices are [latex]\left(\pm b,0\right)[/latex]
- the coordinates of the foci are [latex]\left(0,\pm c\right)[/latex]
- the equations of the asymptotes are [latex]y=\pm \frac{a}{b}x[/latex]
- If the equation is in the form [latex]\frac{{x}^{2}}{{a}^{2}}-\frac{{y}^{2}}{{b}^{2}}=1[/latex], then
- Solve for the coordinates of the foci using the equation [latex]c=\pm \sqrt{{a}^{2}+{b}^{2}}[/latex].
- Plot the vertices, co-vertices, foci, and asymptotes in the coordinate plane, and draw a smooth curve to form the hyperbola.
Example: Graphing a Hyperbola Centered at (0, 0)
Graph the hyperbola given by the equation [latex]\frac{{y}^{2}}{64}-\frac{{x}^{2}}{36}=1[/latex]. Identify and label the vertices, co-vertices, foci, and asymptotes.

Try It
Graph the hyperbola given by the equation [latex]\frac{{x}^{2}}{144}-\frac{{y}^{2}}{81}=1[/latex]. Identify and label the vertices, co-vertices, foci, and asymptotes.

Try It
Graphing hyperbolas centered at a point [latex]\left(h,k\right)[/latex] other than the origin is similar to graphing ellipses centered at a point other than the origin. We use the standard forms [latex]\frac{{\left(x-h\right)}^{2}}{{a}^{2}}-\frac{{\left(y-k\right)}^{2}}{{b}^{2}}=1[/latex] for horizontal hyperbolas, and [latex]\frac{{\left(y-k\right)}^{2}}{{a}^{2}}-\frac{{\left(x-h\right)}^{2}}{{b}^{2}}=1[/latex] for vertical hyperbolas. From these standard form equations we can easily calculate and plot key features of the graph: the coordinates of its center, vertices, co-vertices, and foci; the equations of its asymptotes; and the positions of the transverse and conjugate axes.
How To: Given a general form for a hyperbola centered at [latex]\left(h,k\right)[/latex], sketch the graph.
- Convert the general form to that standard form. Determine which of the standard forms applies to the given equation.
- Use the standard form identified in Step 1 to determine the position of the transverse axis; coordinates for the center, vertices, co-vertices, foci; and equations for the asymptotes.
- If the equation is in the form [latex]\frac{{\left(x-h\right)}^{2}}{{a}^{2}}-\frac{{\left(y-k\right)}^{2}}{{b}^{2}}=1[/latex], then
- the transverse axis is parallel to the [latex]x[/latex] -axis
- the center is [latex]\left(h,k\right)[/latex]
- the coordinates of the vertices are [latex]\left(h\pm a,k\right)[/latex]
- the coordinates of the co-vertices are [latex]\left(h,k\pm b\right)[/latex]
- the coordinates of the foci are [latex]\left(h\pm c,k\right)[/latex]
- the equations of the asymptotes are [latex]y=\pm \frac{b}{a}\left(x-h\right)+k[/latex]
- If the equation is in the form [latex]\frac{{\left(y-k\right)}^{2}}{{a}^{2}}-\frac{{\left(x-h\right)}^{2}}{{b}^{2}}=1[/latex], then
- the transverse axis is parallel to the [latex]y[/latex] -axis
- the center is [latex]\left(h,k\right)[/latex]
- the coordinates of the vertices are [latex]\left(h,k\pm a\right)[/latex]
- the coordinates of the co-vertices are [latex]\left(h\pm b,k\right)[/latex]
- the coordinates of the foci are [latex]\left(h,k\pm c\right)[/latex]
- the equations of the asymptotes are [latex]y=\pm \frac{a}{b}\left(x-h\right)+k[/latex]
- If the equation is in the form [latex]\frac{{\left(x-h\right)}^{2}}{{a}^{2}}-\frac{{\left(y-k\right)}^{2}}{{b}^{2}}=1[/latex], then
- Solve for the coordinates of the foci using the equation [latex]c=\pm \sqrt{{a}^{2}+{b}^{2}}[/latex].
- Plot the center, vertices, co-vertices, foci, and asymptotes in the coordinate plane and draw a smooth curve to form the hyperbola.
Example: Graphing a Hyperbola Centered at (h, k) Given an Equation in General Form
Graph the hyperbola given by the equation [latex]9{x}^{2}-4{y}^{2}-36x - 40y - 388=0[/latex]. Identify and label the center, vertices, co-vertices, foci, and asymptotes.

Try It
Graph the hyperbola given by the standard form of an equation [latex]\frac{{\left(y+4\right)}^{2}}{100}-\frac{{\left(x - 3\right)}^{2}}{64}=1[/latex]. Identify and label the center, vertices, co-vertices, foci, and asymptotes.

Try It
Parabolas
A parabola is the set of all points [latex]\left(x,y\right)[/latex] in a plane that are the same distance from a fixed line, called the directrix, and a fixed point (the focus) not on the directrix. The line segment that passes through the focus and is parallel to the directrix is called the latus rectum. 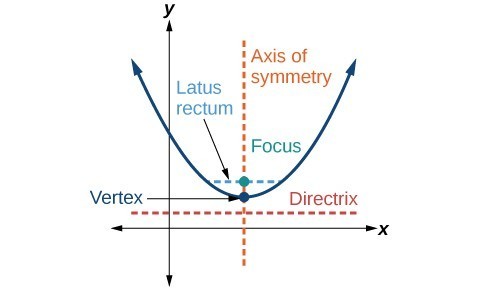
How To: Given a standard form equation for a parabola centered at (0, 0), sketch the graph.
- Determine which of the standard forms applies to the given equation: [latex]{y}^{2}=4px[/latex] or [latex]{x}^{2}=4py[/latex].
- Use the standard form identified in Step 1 to determine the axis of symmetry, focus, equation of the directrix, and endpoints of the latus rectum.
- If the equation is in the form [latex]{y}^{2}=4px[/latex], then
- the axis of symmetry is the [latex]x[/latex] -axis, [latex]y=0[/latex]
- set [latex]4p[/latex] equal to the coefficient of x in the given equation to solve for [latex]p[/latex]. If [latex]p>0[/latex], the parabola opens right. If [latex]p<0[/latex], the parabola opens left.
- use [latex]p[/latex] to find the coordinates of the focus, [latex]\left(p,0\right)[/latex]
- use [latex]p[/latex] to find the equation of the directrix, [latex]x=-p[/latex]
- use [latex]p[/latex] to find the endpoints of the latus rectum, [latex]\left(p,\pm 2p\right)[/latex]. Alternately, substitute [latex]x=p[/latex] into the original equation.
- If the equation is in the form [latex]{x}^{2}=4py[/latex], then
- the axis of symmetry is the [latex]y[/latex] -axis, [latex]x=0[/latex]
- set [latex]4p[/latex] equal to the coefficient of y in the given equation to solve for [latex]p[/latex]. If [latex]p>0[/latex], the parabola opens up. If [latex]p<0[/latex], the parabola opens down.
- use [latex]p[/latex] to find the coordinates of the focus, [latex]\left(0,p\right)[/latex]
- use [latex]p[/latex] to find equation of the directrix, [latex]y=-p[/latex]
- use [latex]p[/latex] to find the endpoints of the latus rectum, [latex]\left(\pm 2p,p\right)[/latex]
- If the equation is in the form [latex]{y}^{2}=4px[/latex], then
- Plot the focus, directrix, and latus rectum, and draw a smooth curve to form the parabola.
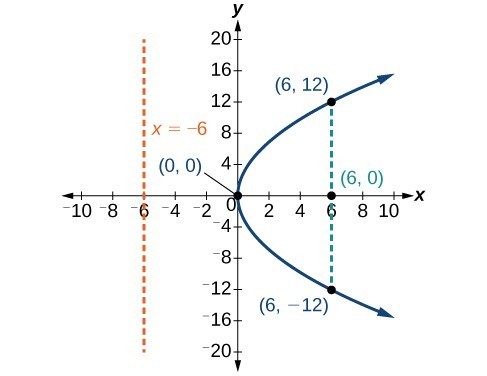
Example: Graphing a Parabola with Vertex (0, 0) and the [latex]x[/latex] -axis as the Axis of Symmetry
Graph [latex]{y}^{2}=24x[/latex]. Identify and label the focus, directrix, and endpoints of the latus rectum.
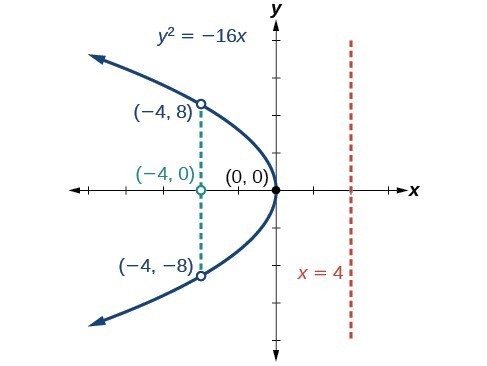
Try It
Graph [latex]{y}^{2}=-16x[/latex]. Identify and label the focus, directrix, and endpoints of the latus rectum.
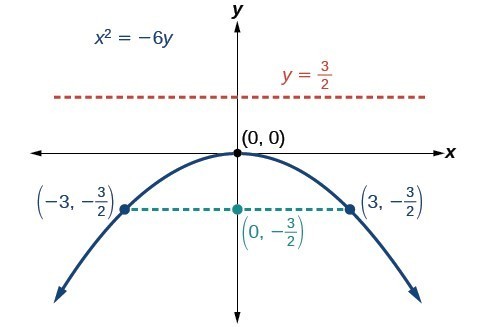
Example: Graphing a Parabola with Vertex (0, 0) and the [latex]y[/latex] -axis as the Axis of Symmetry
Graph [latex]{x}^{2}=-6y[/latex]. Identify and label the focus, directrix, and endpoints of the latus rectum.
Try It
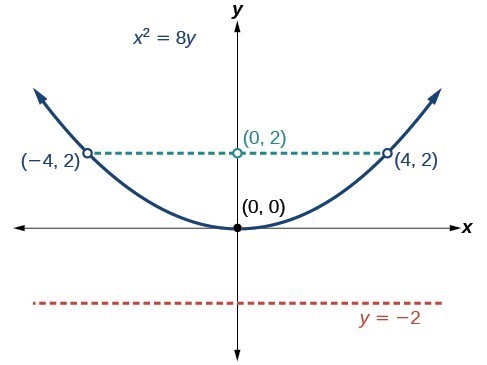
Graph [latex]{x}^{2}=8y[/latex]. Identify and label the focus, directrix, and endpoints of the latus rectum.
To graph parabolas with a vertex [latex]\left(h,k\right)[/latex] other than the origin, we use the standard form [latex]{\left(y-k\right)}^{2}=4p\left(x-h\right)[/latex] for parabolas that have an axis of symmetry parallel to the [latex]x[/latex] -axis, and [latex]{\left(x-h\right)}^{2}=4p\left(y-k\right)[/latex] for parabolas that have an axis of symmetry parallel to the [latex]y[/latex] -axis. These standard forms are given below, along with their general graphs and key features.
A General Note: Standard Forms of Parabolas with Vertex (h, k)
The table and Figure 9 summarize the standard features of parabolas with a vertex at a point [latex]\left(h,k\right)[/latex].
| Axis of Symmetry | Equation | Focus | Directrix | Endpoints of Latus Rectum |
| [latex]y=k[/latex] | [latex]{\left(y-k\right)}^{2}=4p\left(x-h\right)[/latex] | [latex]\left(h+p,\text{ }k\right)[/latex] | [latex]x=h-p[/latex] | [latex]\left(h+p,\text{ }k\pm 2p\right)[/latex] |
| [latex]x=h[/latex] | [latex]{\left(x-h\right)}^{2}=4p\left(y-k\right)[/latex] | [latex]\left(h,\text{ }k+p\right)[/latex] | [latex]y=k-p[/latex] | [latex]\left(h\pm 2p,\text{ }k+p\right)[/latex] |
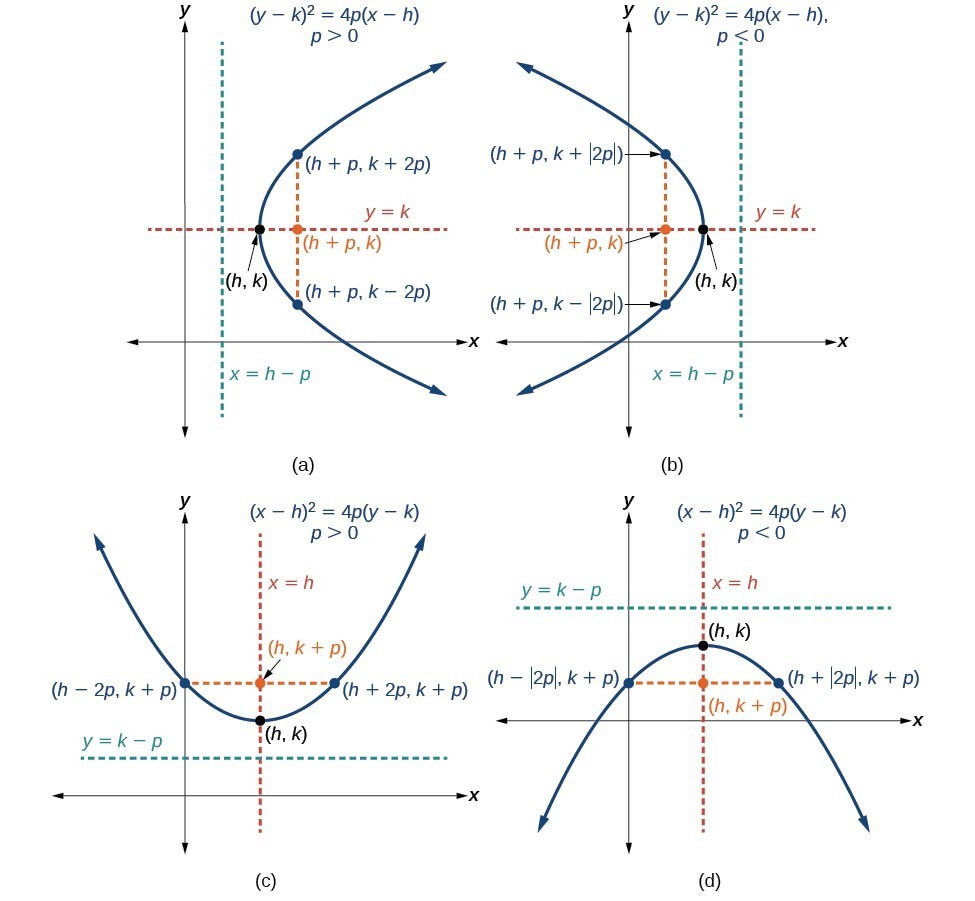
(a) When [latex]p>0[/latex], the parabola opens right. (b) When [latex]p<0[/latex], the parabola opens left. (c) When [latex]p>0[/latex], the parabola opens up. (d) When [latex]p<0[/latex], the parabola opens down.
How To: Given a standard form equation for a parabola centered at (h, k), sketch the graph.
- Determine which of the standard forms applies to the given equation: [latex]{\left(y-k\right)}^{2}=4p\left(x-h\right)[/latex] or [latex]{\left(x-h\right)}^{2}=4p\left(y-k\right)[/latex].
- Use the standard form identified in Step 1 to determine the vertex, axis of symmetry, focus, equation of the directrix, and endpoints of the latus rectum.
- If the equation is in the form [latex]{\left(y-k\right)}^{2}=4p\left(x-h\right)[/latex], then:
- use the given equation to identify [latex]h[/latex] and [latex]k[/latex] for the vertex, [latex]\left(h,k\right)[/latex]
- use the value of [latex]k[/latex] to determine the axis of symmetry, [latex]y=k[/latex]
- set [latex]4p[/latex] equal to the coefficient of [latex]\left(x-h\right)[/latex] in the given equation to solve for [latex]p[/latex]. If [latex]p>0[/latex], the parabola opens right. If [latex]p<0[/latex], the parabola opens left.
- use [latex]h,k[/latex], and [latex]p[/latex] to find the coordinates of the focus, [latex]\left(h+p,\text{ }k\right)[/latex]
- use [latex]h[/latex] and [latex]p[/latex] to find the equation of the directrix, [latex]x=h-p[/latex]
- use [latex]h,k[/latex], and [latex]p[/latex] to find the endpoints of the latus rectum, [latex]\left(h+p,k\pm 2p\right)[/latex]
- If the equation is in the form [latex]{\left(x-h\right)}^{2}=4p\left(y-k\right)[/latex], then:
- use the given equation to identify [latex]h[/latex] and [latex]k[/latex] for the vertex, [latex]\left(h,k\right)[/latex]
- use the value of [latex]h[/latex] to determine the axis of symmetry, [latex]x=h[/latex]
- set [latex]4p[/latex] equal to the coefficient of [latex]\left(y-k\right)[/latex] in the given equation to solve for [latex]p[/latex]. If [latex]p>0[/latex], the parabola opens up. If [latex]p<0[/latex], the parabola opens down.
- use [latex]h,k[/latex], and [latex]p[/latex] to find the coordinates of the focus, [latex]\left(h,\text{ }k+p\right)[/latex]
- use [latex]k[/latex] and [latex]p[/latex] to find the equation of the directrix, [latex]y=k-p[/latex]
- use [latex]h,k[/latex], and [latex]p[/latex] to find the endpoints of the latus rectum, [latex]\left(h\pm 2p,\text{ }k+p\right)[/latex]
- If the equation is in the form [latex]{\left(y-k\right)}^{2}=4p\left(x-h\right)[/latex], then:
- Plot the vertex, axis of symmetry, focus, directrix, and latus rectum, and draw a smooth curve to form the parabola.
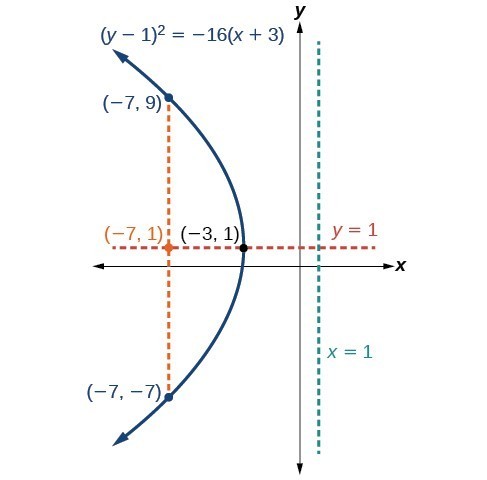
Example: Graphing a Parabola with Vertex (h, k) and Axis of Symmetry Parallel to the [latex]x[/latex] -axis
Graph [latex]{\left(y - 1\right)}^{2}=-16\left(x+3\right)[/latex]. Identify and label the vertex, axis of symmetry, focus, directrix, and endpoints of the latus rectum.
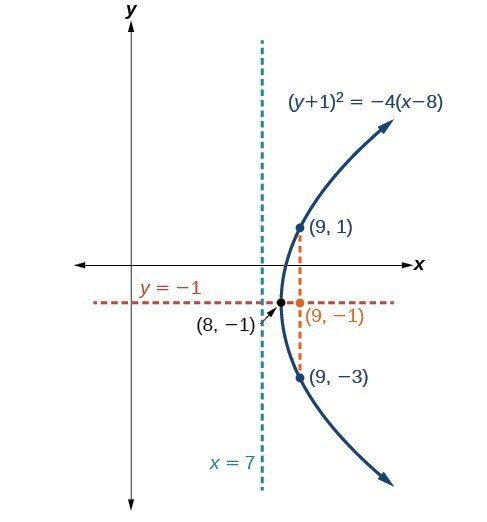
Try It
Graph [latex]{\left(y+1\right)}^{2}=4\left(x - 8\right)[/latex]. Identify and label the vertex, axis of symmetry, focus, directrix, and endpoints of the latus rectum.
Candela Citations
- Calculus Volume 1. Provided by: Lumen Learning. Located at: https://courses.lumenlearning.com/calculus1/. License: CC BY: Attribution
- Calculus Volume 2. Provided by: Lumen Learning. Located at: https://courses.lumenlearning.com/calculus2/. License: CC BY: Attribution