Geological Tools — both physical and conceptual.
Geologic tools encompass both physical tools (equipment, devices, gadgets) and conceptual tools (how to “think” about rocks and naturally occurring earth structures).
What You’ll Learn to Do
- Discuss several tools and their use in geology.
- Understand how to read various maps.
- Find a location using longitude and latitude.
- Identify commonly used geological models.
Geologic Tools
Geologists use a lot of tools to aid their studies.
Common tools include GPS, compasses, rock hammers, hand lenses, and field books.
GPS
Whenever geologists are “in the field” trying to acquire information about rocks, fossils, structures (how rocks are tilted or deformed), and really any natural features, the first and foremost requirement is to know where one is located. Today, thanks to a collection of approximately 30 satellites in geosynchronous orbits, we are able to easily and accurately identify position with GPS devices.
In a nutshell, GPS receivers determine their distance from satellites using travel time differences– if a satellite is close, then signals are received more quickly than if the satellite is far away. Time differences provide distance to satellite.
As long as several satellites are within range and sight, the GPS device can generate mathematical triangulation calculations and establish position.

Compass
The magnetic compass is a key tool for geologists.
In the past (and occasionally today), the compass can help with identification of one’s location, but it is much more commonly used to assess the orientation of some geologic feature.
It might be as simple as the orientation of a ridge or valley, but it could also be a bedding plane (within layered rocks) or a fault zone or the contact between two different rock types.
Ultimately, this sort of information finds it way on to geology maps.
Geologists can use geologic maps as a means to interpret subsurface features and the nature of past deformation and rock movement.
Modern Geological Compasses
Here pictures of the sort of compass that a geologist might use.
Most importantly, the geologic compass is not only useful in determining N-S-E-W directions, but also the “dip” (angle of deviation from a horizontal plane) that rocks or layers might show.
If you take a geology lab class, you may learn about how geologists measure strike and dip.
The “direction” of a rock surface (basically the intersection of the rock plane with a horizontal line) is called strike.
The deviation from of the rock surface from a horizontal plane is called dip.

Setup of a modern geological compass after Prof. Clar (Freiberger), total view |

top view |

bottom side |
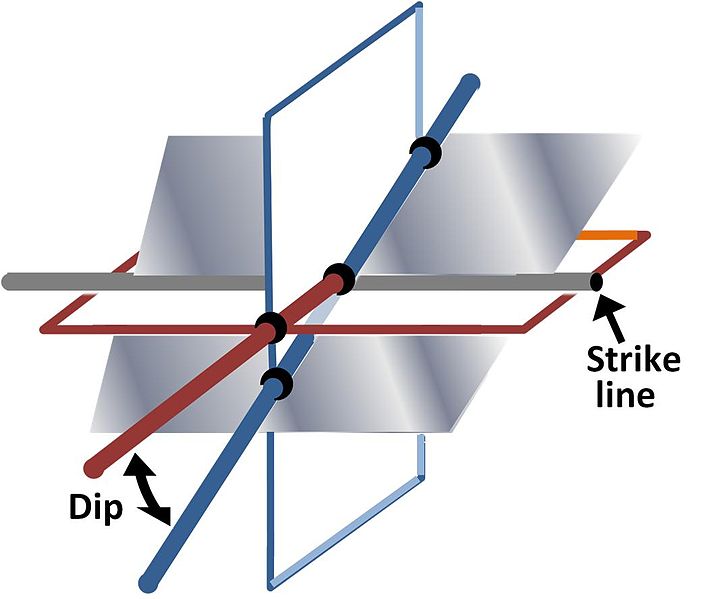
The gray surface (plane) is the “surface of interest”– a sedimentary layer, or a fault zone, or any planar feature. The intersection of our “surface of interest” with a horizontal plane yields a line, and the compass direction of that line is strike. We also speak of the angular deviation between our “surface of interest” and the horizontal, which we call the dip.
Note: With the advent of the smartphone, geological compass programs based on the 3-axis teslameter and the 3-axis accelerometer have also begun to appear. These compass programs compute plane and lineation orientations from the accelerometer and magnetometer data, and permit rapid collection of many measurements. However, some problems are potentially present. Smartphones produce a strong magnetic field of their own which must be compensated by software.
Rock Hammers
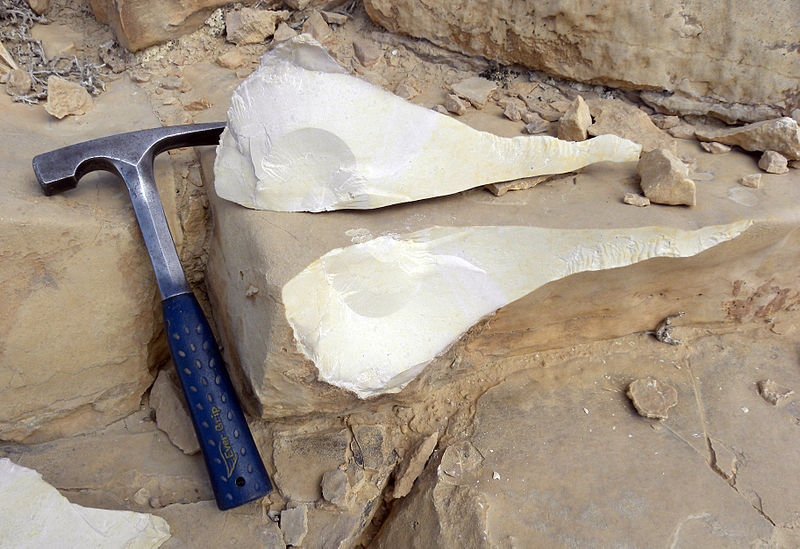
A geologist’s hammer used to break up rocks, as well as a scale in the photograph
A geologist’s hammer, rock hammer, rock pick, or geological pick is a hammer used for splitting and breaking rocks. In field geology, they are used to obtain a fresh surface of a rock to determine its composition, nature, mineralogy, history, and field estimate of rock strength. In fossil and mineral collecting, they are employed to break rocks with the aim of revealing fossils inside. Geologist’s hammers are also sometimes used for scale in a photograph.
Hand Lenses
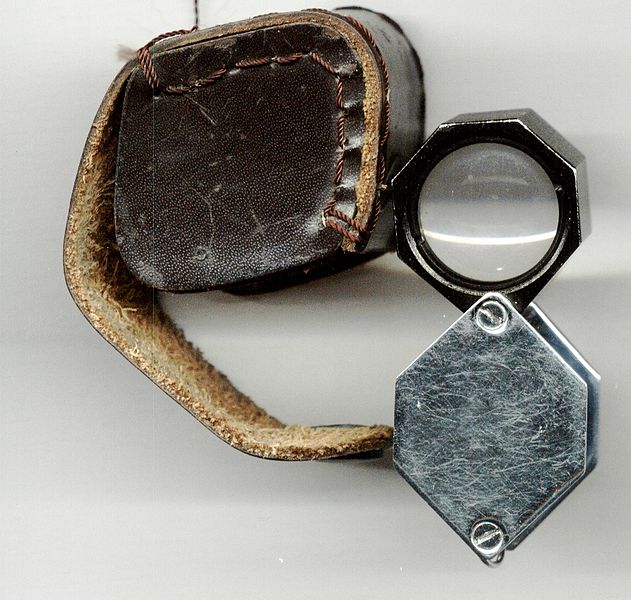
Loupe used by a geologist
The hand lens is an old and vital geological field tool used to identify small mineral crystals, fossils, and/or structures in rocks. It is a simple, small magnification device typically generating magnification around 5-15x. Unlike a magnifying glass, a loupe does not have an attached handle, and its focusing lens(es) are contained in an opaque cylinder or cone or fold into an enclosing housing that protects the lenses when not in use.
Field Books and Notes
Field books are used to take fieldnotes; they can be anything from a composition type notebook to a spiral. Many are specialized, sturdy and somewhat water resistant.
Notes taken in the field are surprisingly useful later on when downloading data into digital and graphical formats.
Geology is very contextual, in the sense that our interpretations of geologic processes depends on conditions and locations!
These notes are of course key to any science that uses descriptive field work– for example, ethnography, biology, ecology, and archaeology.
Notes might fall into two categories:
- Descriptive information is factual data that is being recorded. Factual data includes time and date, the state of the physical setting, social environment, descriptions of the subjects being studied and their roles in the setting, and the impact that the observer may have had on the environment.
- Reflective information is the observer’s reflections about the observation being conducted. These reflections are ideas, questions, concerns, and other related thoughts.
Fieldnotes often include sketches, diagrams, and other drawings.
Maps
Maps are essential tools in geology because they describe the features of earth’s surface! Geology lab courses expose students to both topographic and geologic maps. Below are a few notes on these.
Topographic Maps
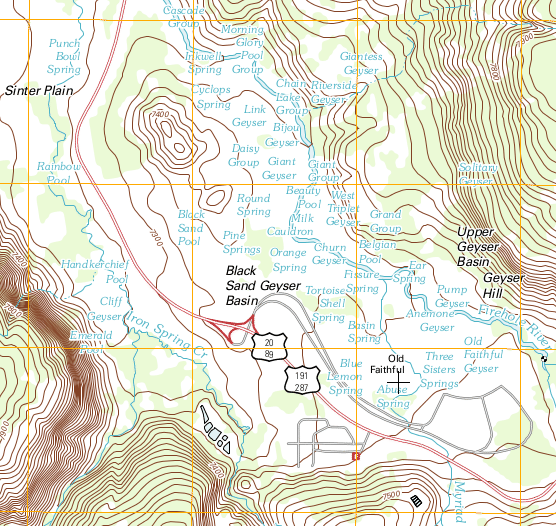
Figure 1. Map of Yellowstone.
A topographic map (like the one in figure 1) is one type of map used by geologists. Topographic maps show the three-dimensional shape of the land and features on the surface of the earth. Topographic maps are also used by hikers, planners who make decisions on zoning and construction permits, government agencies involved in land use planning and hazard assessments, and civil engineers. The topographic maps drawn and published by the U. S. Geological Survey portray the grids that are used on deeds to identify the location of real estate, so homeowners and property owners sometimes find it useful to refer to topographic maps of their area.
Topographic maps make use of contour lines to depict elevations above sea level. Each contour line represents a line of constant elevation– running your finger along a line, or actually going out and walking a line, means that your elevation of above sea level remains constant. Those proficient with “topo maps” are able to visualize three dimensional features like mountains, plains, ridges, or valleys simply by looking at the 2-D image.
Why do geologists care about 3-D structures? Earth’s 3-D surface features are fundamentally a result of some combination of rock type, rock deformation, and/or erosion!
The topographic map is the starting point for a geologic map. A geologic map is (at its essence) simply a topographic map that has been colored to show the location of different rock types; symbols are added to show structures like rock breaking planes (faults and fractures) and rock bends (folds).
Note On USGS Maps:
Standard United States Geological Survey topographic maps cover a quadrangle. A map quadrangle spans a fraction of a degree of longitude east-to-west and the same fraction of a degree of latitude north-to-south. Because lines of longitude degrees (also called meridians) in the Northern Hemisphere come closer and closer together the nearer they get to the North Pole, whereas lines of latitude degrees remain the same distance apart as they circle the earth, quadrangle maps span less distance east-to-west than they do north-to-south.
Two common quadrangle sizes are 7.5 minutes (1/8 of a degree), and 15 minutes (1/4 of a degree).
Name, Size, and Latitude-Longitude of a Topographic Map Quadrangle

Map Scale, Contour Interval, and Magnetic Declination

Important information is shown at the bottom of a USGS quadrangle map, including the map scale, the contour interval, and the magnetic declination. The image above is from the bottom of the Juniper 7.5 minute quadrangle. It tells you, among other things:
- The map scale. The map scale is listed in terms of the fractional scale as 1:24,000. This means that 1 inch on the map corresponds to 24,000 inches in the real world represented by the map, or 1 cm equals 24,000 cm; in other words, distances on the map have been shrunk by a factor of 24,000 from their real-world size. Beneath the fractional scale, the map scale is also depicted a different way, in bar scales using three different units. One of the bar scales is in miles, one is in units of thousands of feet, and one is in kilometers.
- The contour interval, the difference in elevation between adjacent contour lines on the map, is listed below the map scale as 20 feet.
- Declination refers to the “drift” or change in relative position of geographic (rotation axis) pole with the magnetic pole. These are generally close in terms of location, but they are rarely exactly coincident.
Constructing a Topographic Profile
In the diagram below, you see an idealized topo map, with a line drawn on it, from A to A’.
It’s often useful (certainly by geologists but many other users, including hikers and mountain bikers!) to construct a kind of graph that shows the “ups and downs” of topography across a line like A-A’, and called a topographic profile.
Although tedious to do by hand (many computer programs can generate these graphs), a topographic profiles is simply a graph showing the various surface elevation changes as one moves from point A to A’
Step 5
Here’s a completed topo profile.

Notice on the topographic profile constructed above that the peak of the hill is above 520 ft, but below 540 ft. Similarly, the ends of the profile are below 400 ft but above 380. This is consistent with the elevations of those parts of the line of profile on the map.
Note that the vertical scale on the profile is very different from the horizontal scale on the map. In this example, the map covers 0.25 miles horizontally in less distance than the profile covers 100 feet vertically. As a result, the topographic profile is greatly exaggerated vertically. In an actual view of the hill, looking at it from the side, it would not look nearly as steep as it does in the topographic profile that we have constructed.
Comparing the profile to the topographic map notice that the hill is steeper on the west (left) side than on the east (right) side. This is consistent with the contour lines being spaced more closely on the west side of the hill and farther apart on the east side of the hill. Closely spaced contours indicate steep slopes!
Bathymetric Maps
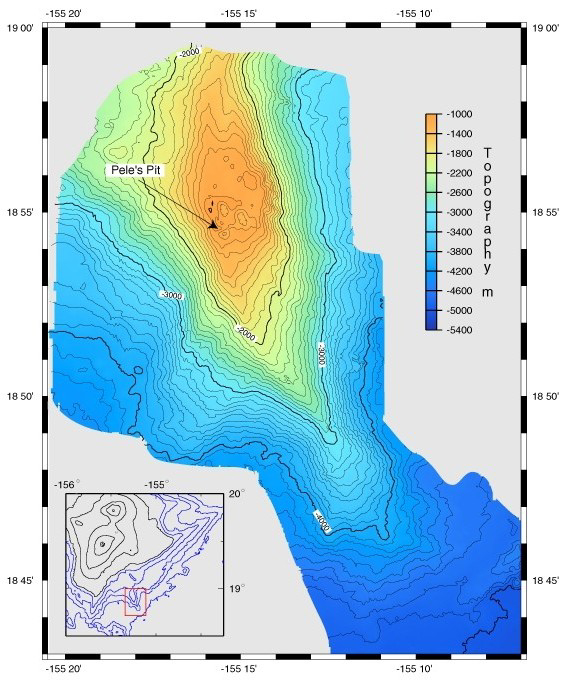
Figure 3. Loihi volcano growing on the flank of Kilauea volcano in Hawaii. Black lines in the inset show the land surface above sea level and blue lines show the topography below sea level. Click on the image to view a larger version.
A bathymetric map is like a topographic map with the contour lines representing depth below sea level, rather than height above. Numbers are low near sea level and become higher with depth.
Kilauea is the youngest volcano found above sea level in Hawaii. On the flank of Kilauea is an even younger volcano called Loihi. The bathymetric map pictured in figure 3 shows the form of Loihi.
Geologic Maps
A geologic map is simply a topographic map with added information about rocks and rock features.
The first thing one notices about a geologic map is that they are quite colorful. Each color represents a particular rock type or rock age-group. Additionally, various symbols are imposed on the map which indicates rock features such as folds (bent or warped rocks) and faults (planar to semi-planar zones of rock breakage). All of these colors and symbols are reviewed in the map key or legend.
A particular color zone on the map represents a rock unit that can be consistently recognized, traced across a landscape, and described, such that in the hands of another geologist these units can be identified and verified.
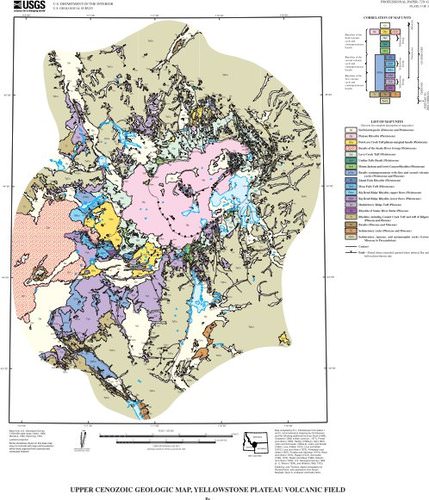
Figure 4. A geologic map of the region around Old Faithful, Yellowstone National Park.
Geologic maps are useful inasmuch as they provide a visual image of key geologic features over a broad area.
They can be used to generate “cross sections” showing the subsurface geology and orientation of rocks units at depth.
Why is all this useful?
Firstly, because this is the starting point for making interpretations about the geologic history of a region (including what sort of conditions were at the surface during past eras, and also what sort of forces contorted the rocks at depth). Secondly, there are all kinds of practical applications, whereby geologic maps are crucial– such as zoning, civil engineering, groundwater and hazard assessment.
.
What do we find on a geologic map?
The legend or key to a geologic map is usually printed on the same page as the map and follows a customary format. The symbol for each rock or sediment unit is shown in a box next to its name and brief description. These symbols are stacked in age sequence from oldest at the bottom to youngest at the top. The geologic era, or period, or epoch–the geologic age–is listed for each rock unit in the key. By stacking the units in age sequence from youngest at the top to oldest at the bottom, and identifying which interval of geologic time each unit belongs to, the map reader can quickly see the age of each rock or sediment unit. The map key also contains a listing and explanation of the symbols shown on the map, such as the symbols for different types of faults and folds. See the Table of Geologic Map Symbols for pictures and an overview of the map symbols, including strikes and dips, faults, folds, and an overview.
Table of Geologic Map Symbols
| Strike and Dip Symbols | ||
|---|---|---|
| Strike and dip are a way of representing the three-dimensional orientation of a planar surface on a two-dimensional map. The strike is the compass direction of a horizontal line on the plane. All the horizontal lines on a plane are parallel, so they all have the same characteristic compass direction. The dip is the angle at which the plane slopes downhill from the horizontal, at its maximum slope, which is at right angles (90º) from strike. | ||
| Map Symbol | Definition | Explanation of symbol |
 |
strike and dip of beds other than horizontal or vertical |
|
 |
horizontal beds |
|
 |
strike and dip of vertical beds |
|
| Geologic Fault Symbols | ||||
|---|---|---|---|---|
| Type of Fault | Map Symbol | Definition | Type of Regional Stress | Geologic Associations |
| normal |  |
hanging wall down, footwall up | tension |
|
| detachment |  |
low-angle normal fault, footwall—gneiss, hanging wall—shallow-crust rocks | tension |
|
| thrust |  |
hanging wall up, footwall down | compression |
|
| reverse | |
high-angle (45° or more dip) thrust fault | compression |
|
| strike-slip |  |
rocks on either side move horizontally in opposite directions | shear |
|
| oblique-slip |  |
combines horizontal and vertical motion | combination |
|
| Geologic Fold Symbols | |||
|---|---|---|---|
| Type of Fold | Map Symbol | Definition | Appearance of Beds in Map View |
| anticline |  |
up fold |
|
| plunging anticline |  |
up fold with tilted axis |
|
| syncline |  |
down fold |
|
| plunging syncline |  |
down fold with tilted axis |
|
| monocline |  |
strata tilted in one direction |
|
| structural dome |  |
upward bulge in layered rocks |
|
| structural basin |  |
downward bulge in layered rocks |
|
The explanations of rock units are often given in a separate pamphlet that accompanies the map. The explanations include descriptions with enough detail for any geologist to be able to recognize the units and learn how their ages were determined.
If included, cross-sections are usually printed on the same page as the geologic map. They are important accompaniments to geologic maps, especially if the map focuses on the geology of the bedrock underneath the soil and loose sediments.
Geologic Cross-Sections
A geologic cross-section is a sideways view of a slice of the earth. It shows how the different types of rock are layered or otherwise configured, and it portrays geologic structures beneath the earth’s surface, such as faults and folds. Geologic cross-sections are constructed on the basis of the geology mapped at the surface combined with an understanding of rocks in terms of physical behavior and three-dimensional structures.
Summary
- Earth scientists regularly use topographic, bathymetric, and geologic maps.
- Topographic maps reveal the shape of a landscape. Elevations indicate height above sea level.
- Bathymetric maps are like topographic maps of features found below the water. Elevations indicate depth below sea level.
- Geologic maps show rock units and geologic features like faults and folds.
Making MODELS as a Means to Do Science!
A physical model is a representation of something using objects. It can be three-dimensional, like a globe. It can also be a two-dimensional drawing or diagram. Models are usually smaller and simpler than the real object. They most likely leave out some parts, but contain the important parts. In a good model the parts are made or drawn to scale. Physical models allow us to see, feel and move their parts. This allows us to better understand the real system.
An example of a physical model is a drawing of the layers of Earth (figure 6). A drawing helps us to understand the structure of the planet. Yet there are many differences between a drawing and the real thing. The size of a model is much smaller, for example. A drawing also doesn’t give good idea of how substances move. Arrows showing the direction the material moves can help. A physical model is very useful but it can’t explain the real Earth perfectly.
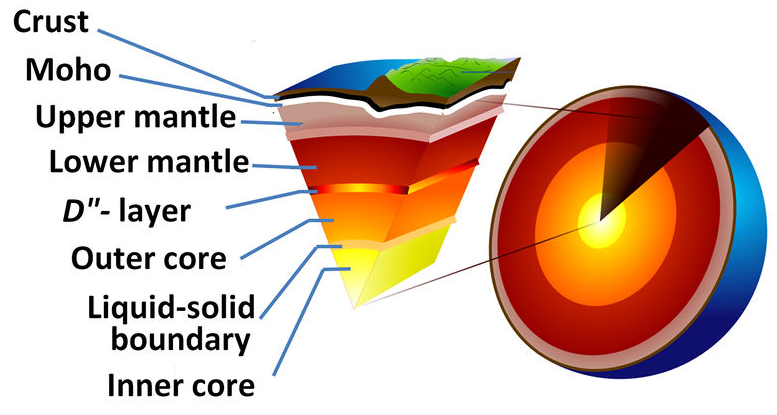
Figure 6. Earth’s Center.
Ideas as Models
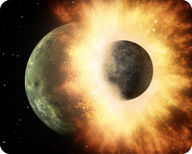
Figure 7. A collision showing a meteor striking Earth.
Some models are based on an idea that helps scientists explain something. A good idea explains all the known facts. An example is how Earth got its Moon. A Mars-sized planet hit Earth and rocky material broke off of both bodies (figure 7). This material orbited Earth and then came together to form the Moon. This is a model of something that happened billions of years ago. It brings together many facts known from our studies of the Moon’s surface. It accounts for the chemical makeup of rocks from the Moon, Earth, and meteorites. The physical properties of Earth and Moon figure in as well. Not all known data fits this model, but much does. There is also more information that we simply don’t yet know.
Models that Use Numbers
Models may use formulas or equations to describe something. Sometimes math may be the only way to describe it. For example, equations help scientists to explain what happened in the early days of the universe. The universe formed so long ago that math is the only way to describe it. A climate model includes lots of numbers, including temperature readings, ice density, snowfall levels, and humidity. These numbers are put into equations to make a model. The results are used to predict future climate. For example, if there are more clouds, does global temperature go up or down? Models are not perfect because they are simple versions of the real situation. Even so, these models are very useful to scientists. These days, models of complex things are made on computers.
Geologic Modelling
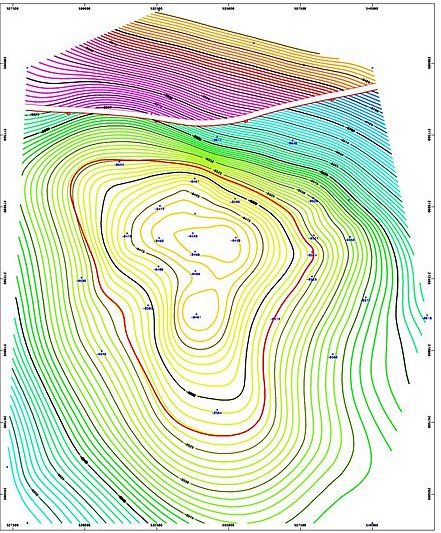
Figure 8. Geological mapping software displaying a screenshot of a structure map generated for an 8500ft deep gas & Oil reservoir in the Erath field, Vermilion Parish, Erath, Louisiana. The left-to-right gap, near the top of the contour map indicates a Fault line. This fault line is between the blue/green contour lines and the purple/red/yellow contour lines. The thin red circular contour line in the middle of the map indicates the top of the oil reservoir. Because gas floats above oil, the thin red contour line marks the gas/oil contact zone.
Geologic modelling, or Geomodelling, is the applied science of creating computerized representations of portions of the Earth’s crust based on geophysical and geological observations made on and below the Earth surface. A Geomodel is the numerical equivalent of a three-dimensional geological map complemented by a description of physical quantities in the domain of interest. Geomodelling is related to the concept of Shared Earth Model; which is a multidisciplinary, interoperable and updatable knowledge base about the subsurface.
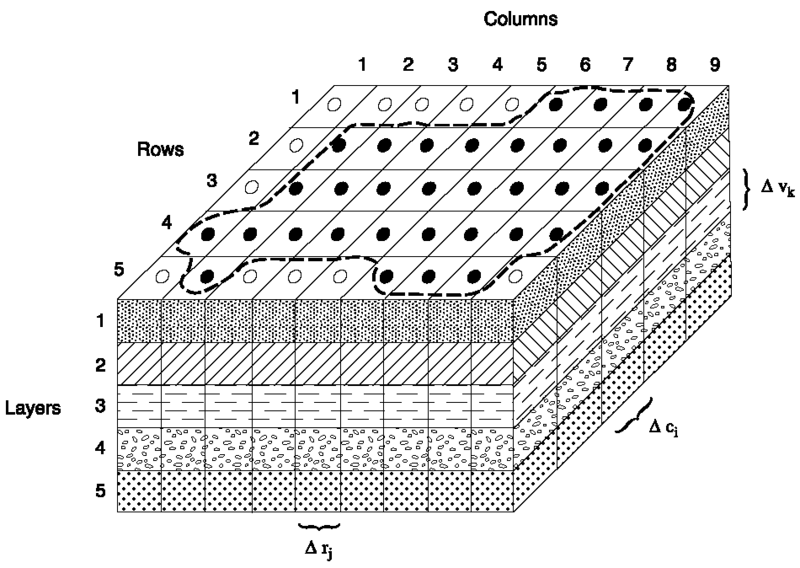
Figure 9. A 3D finite difference grid used in MODFLOW for simulating groundwater flow in an aquifer.
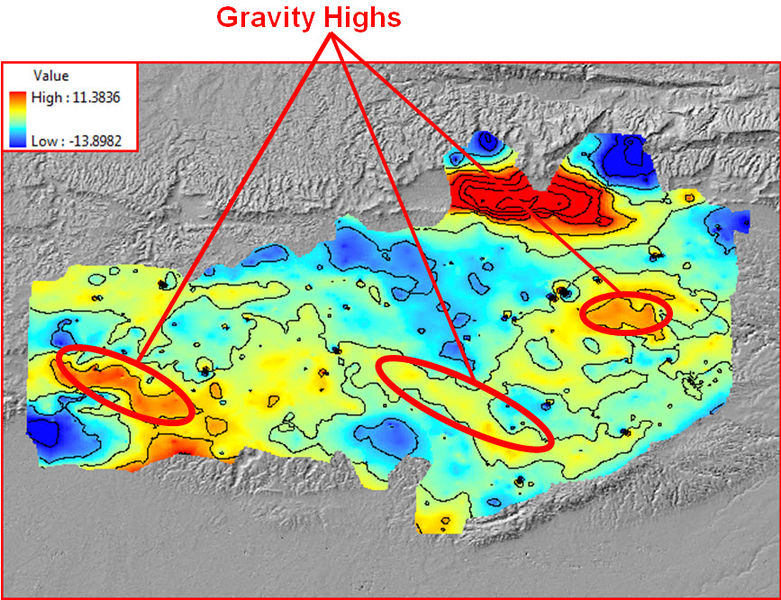
Figure 10. Gravity Highs
:
Candela Citations
- Introduction to Scientific Tools. Authored by: Kimberly Schulte and Lumen Learning. Provided by: Lumen Learning. License: CC BY: Attribution
- Revision, Adaptation, and Original Content. Authored by: Kimberly Schulte and Lumen Learning. Provided by: Lumen Learning. License: CC BY-SA: Attribution-ShareAlike
- Geological compass. Provided by: Wikipedia. Located at: https://en.wikipedia.org/wiki/Geological_compass. License: CC BY-SA: Attribution-ShareAlike
- Geologist's hammer. Provided by: Wikipedia. Located at: https://en.wikipedia.org/wiki/Geologist%27s_hammer. License: CC BY-SA: Attribution-ShareAlike
- Loupe. Provided by: Wikipedia. Located at: https://en.wikipedia.org/wiki/Loupe. License: CC BY-SA: Attribution-ShareAlike
- Fieldnotes. Provided by: Wikipedia. Located at: https://en.wikipedia.org/wiki/Fieldnotes. License: CC BY-SA: Attribution-ShareAlike
- 2.5: Maps. Provided by: CK-12. Located at: http://www.ck12.org/book/CK-12-Earth-Science-Concepts-For-High-School/section/2.5/. License: CC BY-NC: Attribution-NonCommercial
- Basics -- Topographic & Geologic Maps. Authored by: Ralph L. Dawes, Ph.D. and Cheryl D. Dawes. Provided by: Wenatchee Valley College. Located at: https://commons.wvc.edu/rdawes/G101OCL/Basics/mapkey.html. Project: Geology 101 - Introduction to Physical Geology. License: CC BY: Attribution
- 2.4: Location and Direction. Provided by: CK-12. Located at: http://www.ck12.org/book/CK-12-Earth-Science-Concepts-For-High-School/section/2.4/. License: CC BY-NC: Attribution-NonCommercial
- Old Faithful Rainbow. Authored by: Flicka. Located at: https://commons.wikimedia.org/wiki/File:Old_Faithful_Rainbow.jpg. License: CC BY-SA: Attribution-ShareAlike
- 1.1: The Nature of Science. Provided by: CK-12. Located at: http://www.ck12.org/book/CK-12-Earth-Science-For-Middle-School/section/1.1/. License: CC BY-NC: Attribution-NonCommercial
- Geologic modelling. Provided by: Wikipedia. Located at: https://en.wikipedia.org/wiki/Geologic_modelling. License: CC BY-SA: Attribution-ShareAlike
- UCLA's Augmented Reality Sandbox. Authored by: UCLA. Located at: https://youtu.be/CE1B7tdGCw0. License: All Rights Reserved. License Terms: Standard YouTube License
- Latitude and Longitude. Authored by: Andy Jensen. Located at: https://youtu.be/swKBi6hHHMA. License: All Rights Reserved. License Terms: Standard YouTube License
- Loihi Bathemetric. Authored by: NOAA. Located at: https://commons.wikimedia.org/wiki/File:LoihiBathemetric.jpg. License: Public Domain: No Known Copyright