Learning Objectives
- (11.3.1) – Define piecewise function
- (11.3.2) – Evaluate a piecewise function
- (11.3.3) – Write a Piecewise Defined Function
- (11.3.4) – Graph Piecewise Functions
- Given a piecewise-defined function, sketch a graph
- Write the domain and range of a piecewise function given a graph
Some functions come in pieces. In this section, we will learn about how to define and graph functions that are essentially collections of discrete pieces. Examples of something defined this way include designing the profile of a car, figuring out your mobile phone plan, and calculating income tax rates. For example, your tax rate depends on your income and is the same for a range of incomes, as is shown in the table below:
| Marginal Tax Rate | Single Taxable Income | Married Filing Jointly or Qualified Widow(er) Taxable Income | Married Filing Separately Taxable Income | Head of Household Taxable Income |
|---|---|---|---|---|
| 10% | $0 – $9,275 | $0 – $18,550 | $0 – $9,275 | $0 – $13,250 |
| 15% | $9,276 – $37,650 | $18,551 – $75,300 | $9,276 – $37,650 | $13,251 – $50,400 |
| 25% | $37,651 – $91,150 | $75,301 – $151,900 | $37,651 – $75,950 | $50,401 – $130,150 |
| 28% | $91,151 – $190,150 | $151,901 – $231,450 | $75,951 – $115,725 | $130,151 – $210,800 |
| 33% | $190,151 – $413,350 | $231,451 – $413,350 | $115,726 – $206,675 | $210,801 – $413,350 |
| 35% | $413,351 – $415,050 | $413,351 – $466,950 | $206,676 – $233,475 | $413,351 – $441,000 |
| 39.6% | $415,051+ | $466,951+ | $233,476+ | $441,001+ |
(11.3.1) – Define piecewise function
A piecewise function is a function in which more than one formula is used to define the output over different pieces of the domain.
We use piecewise functions to describe situations in which a rule or relationship changes as the input value crosses certain “boundaries.” For example, we often encounter situations in business for which the cost per piece of a certain item is discounted once the number ordered exceeds a certain value. Tax brackets are another real-world example of piecewise functions. For example, consider a simple tax system in which incomes up to [latex]\$10,000[/latex] are taxed at [latex]10\%[/latex], and any additional income is taxed at [latex]20\%[/latex]. The tax on a total income, [latex]S[/latex], would be [latex]0.1S[/latex] if [latex]S\le \$10,000[/latex] and [latex]1000 + 0.2 (S - \$10,000)[/latex], if [latex]S> \$10,000[/latex].
Piecewise Function
A piecewise function is a function in which more than one formula is used to define the output. Each formula has its own domain, and the domain of the function is the union of all these smaller domains. We notate this idea like this:
[latex]f\left(x\right)=\begin{cases}\text{formula 1 if x is in domain 1}\\ \text{formula 2 if x is in domain 2}\\ \text{formula 3 if x is in domain 3}\end{cases}[/latex]
In piecewise notation, the absolute value function is
(11.3.2) – Evaluate a Piecewise Defined Function
In the first example, we will show how to evaluate a piecewise defined function. Note how it is important to pay attention to the domain to determine which expression to use to evaluate the input.
Example
Given the function
[latex]f(x)=\begin{cases}7x+3\text{ if }x<0\\7x+6\text{ if }x\ge{0}\end{cases}[/latex],
evaluate:
- [latex]f (-1)[/latex]
- [latex]f (0)[/latex]
- [latex]f (2)[/latex]
In the following video we show how to evaluate several values given a piecewise defined function.
In the next example we show how to evaluate a function that models the cost of data transfer for a phone company.
Example
A cell phone company uses the function below to determine the cost, [latex]C[/latex], in dollars for [latex]g[/latex] gigabytes of data transfer.
Find the cost of using 1.5 gigabytes of data and the cost of using 4 gigabytes of data.
Analysis of the Solution
The function is represented in the graph below. We can see where the function changes from a constant to a line with a positive slope at [latex]g=2[/latex]. We plot the graphs for the different formulas on a common set of axes, making sure each formula is applied on its proper domain.
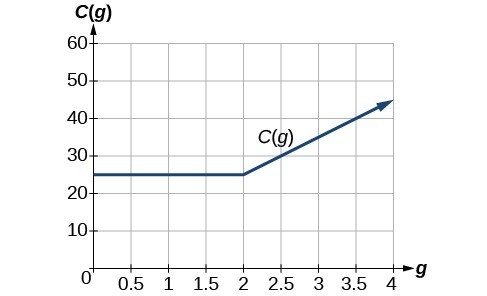
C(g) = [latex]C\left(g\right)=\begin{cases}{25}\text{ if }{ 0 }<{ g }<{ 2 }\\ 10g+5\text{ if }{ g}\ge{ 2 }\end{cases}[/latex]
(11.3.3) - Write a Piecewise Defined Function
In the last example we will show how to write a piecewise defined function that models the price of a guided museum tour.
Example
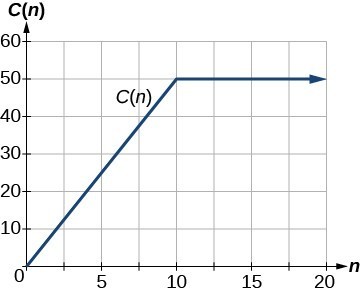
A museum charges $5 per person for a guided tour with a group of 1 to 9 people or a fixed $50 fee for a group of 10 or more people. Write a function relating the number of people, [latex]n[/latex], to the cost, [latex]C[/latex].
In the following video we show an example of writing a piecewise defined function given a scenario.
Given a piecewise function, write the formula and identify the domain for each interval.
- Identify the intervals for which different rules apply.
- Determine formulas that describe how to calculate an output from an input in each interval.
- Use braces and if-statements to write the function.
(11.3.4) - Graph Piecewise Functions
In this section, we will plot piecewise functions. The function plotted below represents the cost to transfer data for a given cell phone company. We can see where the function changes from a constant to a line with a positive slope at [latex]g=2[/latex]. When we plot piecewise functions, it is important to make sure each formula is applied on its proper domain.
[latex]C\left(g\right)=\begin{cases}{25} \text{ if }{ 0 }<{ g }<{ 2 }\\10g+5\text{ if }{ g}\ge{ 2 }\end{cases}[/latex]
In this case, the output is 25 for any input between 0 and 2. For values equal to or greater than 2, the output is defined as [latex]10g+5[/latex].
Given a piecewise function, sketch a graph.
- Indicate on the [latex]x[/latex]-axis the boundaries defined by the intervals on each piece of the domain.
- For each piece of the domain, graph on that interval using the corresponding equation pertaining to that piece. Do not graph two functions over one interval because it would violate the criteria of a function.
Example
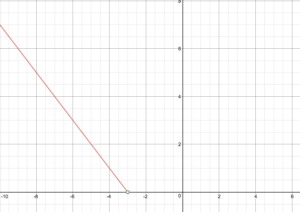
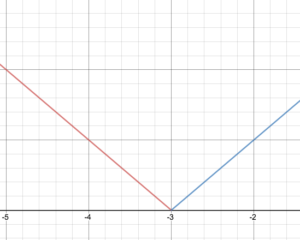
Sketch a graph of the function.
Given the piecewise definition [latex]f(x)=\begin{cases}−x − 3\text{ if }x < −3\\ x + 3\text{ if } x \ge −3\end{cases}[/latex] Draw the graph of [latex]f[/latex]. State the domain and range of the function.
In the next example, we will graph a piecewise defined function that models the cost of shipping for an online comic book retailer.
Example
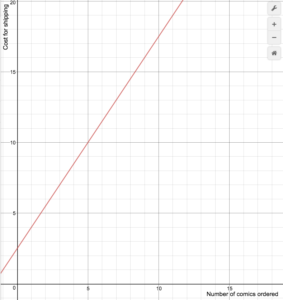
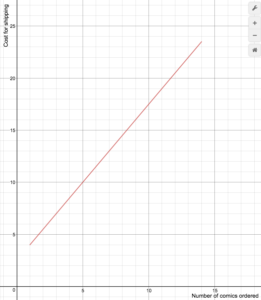
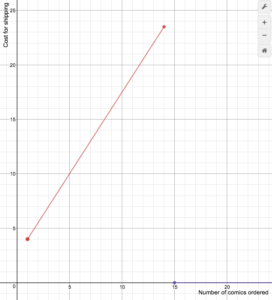
An on-line comic book retailer charges shipping costs according to the following formula
[latex]S(n)=\begin{cases}1.5n+2.5\text{ if }1\le{n}\le14\\0\text{ if }n\ge15\end{cases}[/latex]
Draw a graph of the cost function.
In the following video we show how to graph a piecewise defined function which is linear over both domains.
Example: Graphing a Piecewise Function
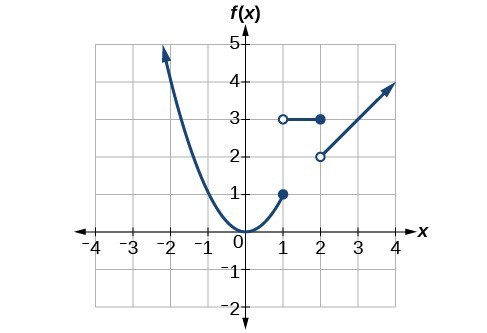
Sketch a graph of the function.
[latex]f\left(x\right)=\begin{cases}{ x }^{2} \text{ if }{ x }\le{ 1 }\\ { 3 } \text{ if } { 1 }<{ x }\le 2\\ { x } \text{ if }{ x }>{ 2 }\end{cases}[/latex]

Example
Graph the following piecewise function.
[latex]f\left(x\right)=\begin{cases}{ x}^{3} \text{ if }{ x }<{-1 }\\ { -2 } \text{ if } { -1 }<{ x }<{ 4 }\\ \sqrt{x} \text{ if }{ x }>{ 4 }\end{cases}[/latex]

Try It
Q&A
Can more than one formula from a piecewise function be applied to a value in the domain?
No. Each value corresponds to one equation in a piecewise formula.
Candela Citations
- Revision and Adaptation. Provided by: Lumen Learning. License: CC BY: Attribution
- Determine a Basic Piecewise Defined Function. Authored by: James Sousa (Mathispower4u.com) for Lumen Learning. Located at: https://youtu.be/58mEZ4mEnUI. License: CC BY: Attribution
- Ex: Determine Function Values for a Piecewise Defined Function. Authored by: James Sousa (Mathispower4u.com) . Located at: https://youtu.be/E2F2-gP-2qU. License: CC BY: Attribution
- College Algebra, Unit 1.4 Function Notation. Authored by: Carl Stitz and Jeff Zeager. Located at: http://www.stitz-zeager.com/szca07042013.pdf. License: CC BY: Attribution
- Ex 2: Graph a Piecewise Defined Function. Authored by: James Sousa (Mathispower4u.com) . Located at: https://youtu.be/B1jfpiI-QQ8. License: CC BY: Attribution
- Precalculus. Authored by: Jay Abramson, et al.. Provided by: OpenStax. Located at: http://cnx.org/contents/fd53eae1-fa23-47c7-bb1b-972349835c3c@5.175. License: CC BY: Attribution. License Terms: Download For Free at : http://cnx.org/contents/fd53eae1-fa23-47c7-bb1b-972349835c3c@5.175.