Maps are essential tools in geology. Maps are as important in geology as written texts are in the study of literature. By studying maps, a geologist can see the shape and geology of the earth’s surface and deduce the geological structures that lie hidden beneath the surface. Geologists are trained in map reading and map making. Many geologists have experience mapping some part of the earth’s surface.
It takes some training to read maps skillfully. You are not expected to become a geological expert in reading maps. However, you will be expected to develop your map reading skills as you use maps to help you learn geology.
Topographic Maps
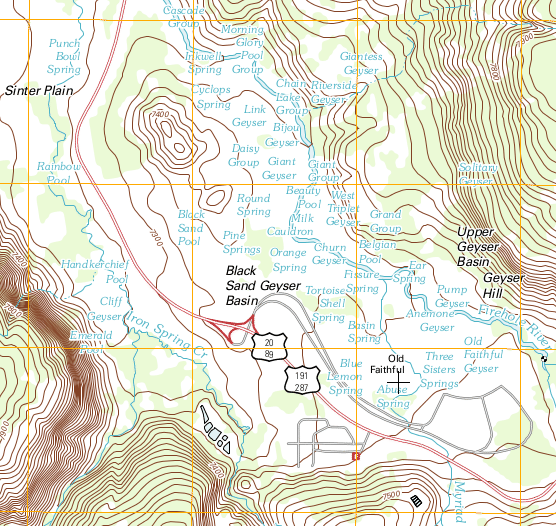
Figure 1. Map of Yellowstone.
A topographic map (like the one in figure 1) is one type of map used by geologists. Topographic maps show the three-dimensional shape of the land and features on the surface of the earth. Topographic maps are also used by hikers, planners who make decisions on zoning and construction permits, government agencies involved in land use planning and hazard assessments, and civil engineers. The topographic maps drawn and published by the U. S. Geological Survey portray the grids that are used on deeds to identify the location of real estate, so homeowners and property owners sometimes find it useful to refer to topographic maps of their area.
Most topographic maps make use of contour lines to depict elevations above sea level. The contour lines reveal the shape of the land in the vertical direction, allowing the 3-dimensional shape of the land to be portrayed on a 2-dimensional sheet of paper or computer screen. When you know how to read contour lines, you can look at them on a topographic map and visualize the mountains, plains, ridges, or valleys that they portrays.
Topographic maps are important in geology because they portray the surface of the earth in detail. This view of the surface shows patterns that provide information about the geology beneath the surface.
The landforms of the earth result from surface processes such as erosion or sedimentation combined with internal geological processes such as magma rising to create a volcano or a ridge of bedrock pushed up along a fault. By studying the shape of the earth’s surface through topographic maps, geologists can understand the nature of surface processes in a given area, including zones subjected to landsliding, places undergoing erosion and places where sediment is accumulating. They can also find clues to the underlying geologic structure and geologic history of the area.
In addition to a topographic map, a complete understanding of the underlying geologic structure and history of an area requires completion of a geologic map and cross-sections. A topographic map provides the frame of reference upon which most geologic maps are constructed.
Reading a Topographic Map
Reading a topographic map requires familiarity with how it portrays the three-dimensional shape of the land, so that in looking at a topographic map you can visualize the shape of the land. To read a topographic map, you need to understand the rules of contour lines.
Rules for Contour Lines
- A contour line connects all the points on a map area that are at a specific elevation. For example, every point on a 600-foot contour line represents a point on earth that is 600 feet above sea level. You can visualize a contour line as the shoreline that would exist if the ocean were to cover the land to that elevation.
- The contour interval is the vertical distance, also known as the elevation difference, between adjacent contour lines. On a map with a 40-foot contour interval, the vertical distance between two contour lines that are next to each other, is 40 feet, regardless of the horizontal distance between the two lines on the map.
- Contour lines do not intersect each other, because a point on the surface of the earth cannot be at two different elevations. (However, in the rare case of a vertical cliff showing up on a topographic map, contour lines along the cliff may appear to join together into a single line.)
- Circles that are closed contours generally signify hills.
- Depressions that have no outlet are signified by closed contours with short lines that stick out of them and point toward the center. (The short lines sticking out of the contour lines are called hachures, hatch marks, or tick marks.)
- Contour lines on standard US Geological Survey topographic maps are brown — except on the surfaces of glaciers, where the contour lines are blue.
- The elevation of a point on the map that is not on a contour line must be estimated as greather than the elevation of the nearest contour line below it, and less than elevation of the nearest contour line above it. For example, a point lying midway between the contours 5440 ft and 5480 ft would be at approximately 5460 ft elevation.
- Contour lines curve upstream when they cross a valley. This leads to the “Rule of Vs”: Where they cross streams, contour lines make Vs that point upstream.
- Where contours are close together, the topography is steep; where contour lines are far apart, the slope is gentle or flat.
- The relief on a landscape is the elevation difference between two given points. The maximum relief on a topographic map is the elevation difference between the highest and lowest points on the map.
Map Quadrangles, Latitudes, and Longitudes
Standard United States Geological Survey topographic maps cover a quadrangle. A map quadrangle spans a fraction of a degree of longitude east-to-west and the same fraction of a degree of latitude north-to-south. Because lines of longitude degrees (also called meridians) in the Northern Hemisphere come closer and closer together the nearer they get to the North Pole, whereas lines of latitude degrees remain the same distance apart as they circle the earth, quadrangle maps span less distance east-to-west than they do north-to-south.
Latitude is how far north or south of the equator a point is on earth, measured in degrees, from 0° at the equator to 90° at the poles. When specifying a latitude, always state whether it is in the Northern Hemisphere (N) or Southern Hemisphere (S).
Longitude is how far east or west, up to a maximum of 180°, a point on earth is from the Prime Meridian. The Prime Meridian, 0° longitude, is a north-south line that runs through Greenwhich, England. When specifying a longitude, state whether it is in the Western Hemisphere (W) or Eastern Hemisphere (E).
Meridians, lines of longitude, run from the South Pole to the North Pole, converging (coming together) at the poles. Because the meridians converge at the poles, a degree of longitude gets smaller and smaller near each pole. In contrast, a degree of latitude remains approximately 69 miles across, no matter how near or far from the poles or equator it is.
Degrees of latitude and longitude are divided into arc minutes and arc seconds. In this context, they are usually just called minutes and seconds, but it must be kept in mind that these minutes and seconds are units of angles, not units of time. These units, which divide angles into smaller parts, work as follows:
- There are 60 arc minutes in 1 degree.
- The symbol for minutes is a single apostrophe: ‘.
- In symbols, 60′ = 1° means there are 60 minutes in 1 degree.
- There are 60 arc seconds in 1 arc minute.
- To convert arc minutes into a decimal fraction of a degree, multiply the number of arc minutes by 1°/60′. For example, to convert 15′ into a decimal fraction of a degree, 15′ x 1°/60′ = 0.25°. In simpler terms, just divide the number of arc minutes by 60 to convert to decimal degrees.
- The symbol for arc seconds is a double apostrophe or quotation mark: “.
- In symbols, 60″ = 1′ means there are 60 seconds in 1 minute.
Two common quadrangle sizes are 7.5 minutes (1/8 of a degree), and 15 minutes (1/4 of a degree).
Name, Size, and Latitude-Longitude of a Topographic Map Quadrangle

The image above shows the northeastern corner portion of the topographic map of the Juniper quadrangle, which spans the border of the states of Oregon and Washington. The name of the quadrangle comes from the name of a place on the map. Find the following information using this corner of the map:
- The name of the quadrangle
- The state(s) in which the quadrangle is located
- The size of the quadrangle
- The name and fractional scale of the quadrangle map that is located adjacent to the northeast of the corner corner
- The longitude of the eastern boundary of the map
- The latitude of the northern boundary of the map
Map Scale, Contour Interval, and Magnetic Declination

Important information is shown at the bottom of a USGS quadrangle map, including the map scale, the contour interval, and the magnetic declination. The image above is from the bottom of the Juniper 7.5 minute quadrangle. It tells you, among other things:
- The map scale. The map scale is listed in terms of the fractional scale as 1:24,000. This means that 1 inch on the map corresponds to 24,000 inches in the real world represented by the map, or 1 cm equals 24,000 cm; in other words, distances on the map have been shrunk by a factor of 24,000 from their real-world size. Beneath the fractional scale, the map scale is also depicted a different way, in bar scales using three different units. One of the bar scales is in miles, one is in units of thousands of feet, and one is in kilometers.
- The contour interval, the difference in elevation between adjacent contour lines on the map, is listed below the map scale as 20 feet.
- There is also a reminder that elevations shown on the map are elevations above mean (average) sea level on earth.
- (You might note that this map does something unusual for a topographic map. It shows depths in the Columbia River in feet below the surface of the river when the river is backed up in its reservoir behind a dam to a normal pool surface elevation of 340 feet above sea level.)
- To the left of the bar scales, the magnetic declination is shown as an arrow diverging from a line oriented toward true north. True north is the direction toward the geographic North Pole. The geographic North Pole is where the northern end of earth’s axis of rotation is located. The magnetic North Pole is in northeastern Canada. In 1962, the magnetic North Pole, as measured from the Juniper quadrangle, was located 20.5° east of true north. If you took a magnetic compass to the Juniper quadrangle in 1962, its north arrow would point 20.5° east of true north, so you would have had to set your magnetic compass to compensate for the declination. The magnetic North Pole wanders a few miles every year and the magnetic declination of 20.5° east of true north was determined in the year 1962; it may be slightly different now.
Constructing a Topographic Profile
One of the important tools you can use to extract the vertical information from a topographic map, and see more clearly the shape of the earth’s surface that it represents is a topographic profile.
Construction of a topographic profile allows you to visualize the vertical component of a landscape. A topographic profile is similar to the view you have of a landscape while standing on earth, looking at hills and valleys from the side rather than from above.
Given a topographic map such as the one below, here’s how to construct a topographic profile.

Step 1
Determine the line of profile, the line across that part of the map that you want to see in profile or cross-section view. Depending on which part of the map you want to see in profile, you can draw your line of profile in any direction you choose, across any part of the map you choose. For the map used in this example, we choose to draw the profile from A to A’ as shown in the diagram below, to see the entire length of the hill in profile.
Step 2
Draw a grid that will contain the profile. The width of the grid should be the same as the length of the line of profile. To draw the profile, the grid must be crossed by evenly-spaced horizontal lines that represent the contour elevations. The grid must extend high enough to span the elevation range of the contour lines spanned by the line of profile. You can see that the grid, shown below, includes the range of elevations that the line of profile crosses on the map. In addition, the grid must have an extra horizontal line at the bottom and top to accommodate the parts of the profile that go above the highest contour elevation and below the lowest contour elevation. That is why the grid in the example below goes below 400 feet and above 500 feet in elevation.

Step 3
Transfer the contour elevations from the topographic map to the profile grid. The point where each contour line crosses the line of profile on the topographic map determines the horizontal coordinate of each corresponding point on the grid of the topographic profile. The elevation of each contour line corresponds to the vertical coordinate of each corresponding point on the profile grid, as shown on the diagram below.

Step 4
Now that you have marked the elevation points on the profile grid, draw a smooth line connecting the data points as shown below. Note that the ends of this profile go below the 400 foot contour elevation but they do not extend to the 380 foot elevation because on the map the line of profile did not reach the 380 foot contour line. Also note that the top of the profile reaches a peak above 520 feet but less than 540 feet because the line of profile does not cross the 540 foot contour line.
Step 5
The completed topographic profile and the map it was drawn from are shown below. Topographic profiles are usually constructed without drawing any lines on the map. Instead, the edge of a piece of paper is laid along the line of profile and the contour line data is transferred to the edge of the piece of paper. From the edge of the piece of paper, the data are transfered to the profile grid, which is on a separate piece of paper.

Notice on the topographic profile constructed above that the peak of the hill is above 520 ft, but below 540 ft. Similarly, the ends of the profile are below 400 ft but above 380. This is consistent with the elevations of those parts of the line of profile on the map.
Note that the vertical scale on the profile is very different from the horizontal scale on the map. In this example, the map covers 0.25 miles horizontally in less distance than the profile covers 100 feet vertically. As a result, the topographic profile is greatly exaggerated vertically. In an actual view of the hill, looking at it from the side, it would not look nearly as steep as it does in the topographic profile that we have constructed.
If the vertical scale on a topographic profile is different from the map scale, as it is in this case, then the profile will exhibit a vertical exaggeration. The vertical exaggeration of a topographic profile can be calculated. It is the fractional scale of the topographic profile’s vertical axis, divided by the fractional scale of the map. For example, if the vertical scale on the profile is 1:200 and the map scale is 1:24,000, the vertical exaggeration is [latex]\displaystyle\frac{\left(\frac{1}{200}\right)}{\left(\frac{1}{24,000}\right)}[/latex]. To divide by a fraction, you can invert and multiply, so this becomes [latex]\displaystyle\left(\frac{1}{200}\right)\times\left(\frac{24,000}{1}\right)=\frac{24,000}{200}=120[/latex]. A topographic profile with a VE of 120 would be a very exaggerated topographic profile. It would be as if a rubber model of the landscape has been pulled in the vertical direction, until it is 120 times taller than it really is.
If the vertical scale of a topographic profile is different from the map scale, the vertical exaggeration should be listed next to the profile, such as VE = 10 or VE 10x if the vertical exaggeration is 10.
Compare the profile to the topographic map. You will see that the hill is steeper on the west (left) side than on the east (right) side. This is consistent with the contour lines being spaced more closely on the west side of the hill and farther apart on the east side of the hill. This accords with the rules of contour lines, which state that slopes are steeper where contour lines are more closely spaced, and slopes are less steep where contour lines are more widely spaced.
If you drew a profile from north to south across the peak of the hill, do you think the profile would be symmetric or asymmetric?
Checklist for a Complete Topographic Profile
A properly drawn topographic profile will have the following attributes:
- The topographic profile is drawn on a rectilinear graph with evenly spaced grid lines. (Vertical grid lines are not required.)
- Elevation lines are labeled along the left-hand vertical axis.
- The profile is a smooth curve where its gradient changes, rather than straight-line segments connecting the dots and only bending at the dots.
- If the vertical scale on the profile is different from the map scale, the resulting amount of vertical exaggeration is listed.
- The ends and any high points or low points of the topographic profile should be above or below elevation lines, not on them, except in cases where an end, high point, or low point of a line of profile happens to fall right on a contour line.
Explore More: Topographic Maps
Use this resource to answer the questions that follow. You may stop watching at the 4:04 mark.
- What do topographic maps do and how do they do it?
- What are the meanings of the terms topographic map, contour line, contour interval and index contour?
- If you were to walk along a contour line, what would happen to your elevation?
- If you walk perpendicular to contour lines what are you doing?
- What do close contour lines indicate?
Bathymetric Maps
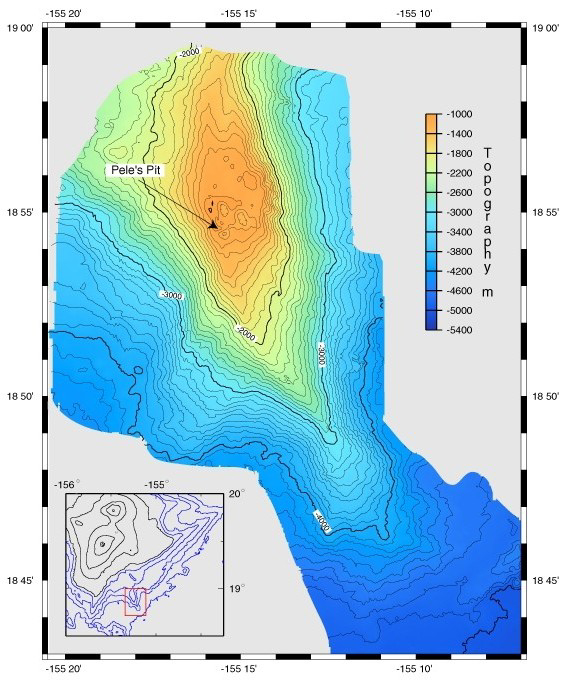
Figure 3. Loihi volcano growing on the flank of Kilauea volcano in Hawaii. Black lines in the inset show the land surface above sea level and blue lines show the topography below sea level. Click on the image to view a larger version.
A bathymetric map is like a topographic map with the contour lines representing depth below sea level, rather than height above. Numbers are low near sea level and become higher with depth.
Kilauea is the youngest volcano found above sea level in Hawaii. On the flank of Kilauea is an even younger volcano called Loihi. The bathymetric map pictured in figure 3 shows the form of Loihi.
Geologic Maps
A geologic map shows the geological features of a region (see figure 4 for an example). Rock units are color-coded and identified in a key. Faults and folds are also shown on geologic maps. The geology is superimposed on a topographic map to give a more complete view of the geology of the region.
A geologic map shows mappable rock units, mappable sediment units that cover up the rocks, and geologic structures such as faults and folds. A mappable unit of rock or sediment is one that a geologist can consistently recognize, trace across a landscape, and describe so that other people are able to recognize it and verify its presence and identity. Mappable units are shown as different colors or patterns on a base map of the geographic area.
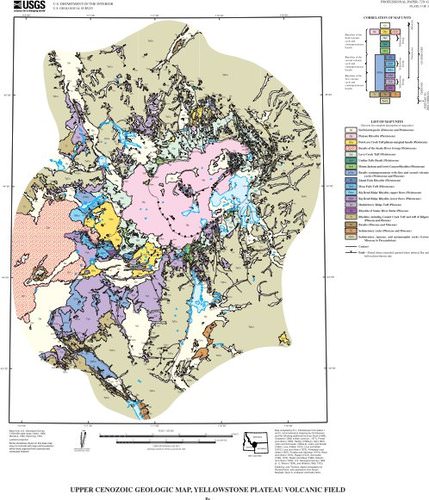
Figure 4. A geologic map of the region around Old Faithful, Yellowstone National Park.
Geologic maps are important for two reasons. First, as geologists make geologic maps and related explanations and cross-sections, they develop a theoretical understanding of the geology and geologic history of a given area.
Second, geologic maps are essential tools for practical applications such as zoning, civil engineering, and hazard assessment. Geologic maps are also vital in finding and developing geological resources, such as gravel to help build the road you drive on, oil to power the car you travel in, or aluminum to build the more fuel-efficient engine in your next vehicle. Another resource that is developed on the basis of geologic maps is groundwater, which many cities, farms, and factories rely on for the water they use.
Essential Components of Geologic Maps
A complete geologic map has at least two features:
- the map itself
- the map legend or key that explains all the symbols on the map.
Professional geologic maps usually have two other components as well:
- an accompanying explanation of the rock or sediment units
- geologic cross-sections of the map area.
The legend or key to a geologic map is usually printed on the same page as the map and follows a customary format. The symbol for each rock or sediment unit is shown in a box next to its name and brief description. These symbols are stacked in age sequence from oldest at the bottom to youngest at the top. The geologic era, or period, or epoch–the geologic age–is listed for each rock unit in the key. By stacking the units in age sequence from youngest at the top to oldest at the bottom, and identifying which interval of geologic time each unit belongs to, the map reader can quickly see the age of each rock or sediment unit. The map key also contains a listing and explanation of the symbols shown on the map, such as the symbols for different types of faults and folds. See the Table of Geologic Map Symbols for pictures and an overview of the map symbols, including strikes and dips, faults, folds, and an overview.
Table of Geologic Map Symbols
| Strike and Dip Symbols | ||
|---|---|---|
| Strike and dip are a way of representing the three-dimensional orientation of a planar surface on a two-dimensional map. The strike is the compass direction of a horizontal line on the plane. All the horizontal lines on a plane are parallel, so they all have the same characteristic compass direction. The dip is the angle at which the plane slopes downhill from the horizontal, at its maximum slope, which is at right angles (90º) from strike. | ||
| Map Symbol | Definition | Explanation of symbol |
 |
strike and dip of beds other than horizontal or vertical |
|
 |
horizontal beds |
|
 |
strike and dip of vertical beds |
|
| Geologic Fault Symbols | ||||
|---|---|---|---|---|
| Type of Fault | Map Symbol | Definition | Type of Regional Stress | Geologic Associations |
| normal |  |
hanging wall down, footwall up | tension |
|
| detachment |  |
low-angle normal fault, footwall—gneiss, hanging wall—shallow-crust rocks | tension |
|
| thrust |  |
hanging wall up, footwall down | compression |
|
| reverse | |
high-angle (45° or more dip) thrust fault | compression |
|
| strike-slip |  |
rocks on either side move horizontally in opposite directions | shear |
|
| oblique-slip |  |
combines horizontal and vertical motion | combination |
|
| Geologic Fold Symbols | |||
|---|---|---|---|
| Type of Fold | Map Symbol | Definition | Appearance of Beds in Map View |
| anticline |  |
up fold |
|
| plunging anticline |  |
up fold with tilted axis |
|
| syncline |  |
down fold |
|
| plunging syncline |  |
down fold with tilted axis |
|
| monocline |  |
strata tilted in one direction |
|
| structural dome |  |
upward bulge in layered rocks |
|
| structural basin |  |
downward bulge in layered rocks |
|
The explanations of rock units are often given in a separate pamphlet that accompanies the map. The explanations include descriptions with enough detail for any geologist to be able to recognize the units and learn how their ages were determined.
If included, cross-sections are usually printed on the same page as the geologic map. They are important accompaniments to geologic maps, especially if the map focuses on the geology of the bedrock underneath the soil and loose sediments.
Geologic Cross-Sections
A geologic cross-section is a sideways view of a slice of the earth. It shows how the different types of rock are layered or otherwise configured, and it portrays geologic structures beneath the earth’s surface, such as faults and folds. Geologic cross-sections are constructed on the basis of the geology mapped at the surface combined with an understanding of rocks in terms of physical behavior and three-dimensional structures.
Summary
- Earth scientists regularly use topographic, bathymetric, and geologic maps.
- Topographic maps reveal the shape of a landscape. Elevations indicate height above sea level.
- Bathymetric maps are like topographic maps of features found below the water. Elevations indicate depth below sea level.
- Geologic maps show rock units and geologic features like faults and folds.
Candela Citations
- Revision and Adaptation. Provided by: Lumen Learning. License: CC BY: Attribution
- 2.5: Maps. Provided by: CK-12. Located at: http://www.ck12.org/book/CK-12-Earth-Science-Concepts-For-High-School/section/2.5/. License: CC BY-NC: Attribution-NonCommercial
- Basics -- Topographic & Geologic Maps. Authored by: Ralph L. Dawes, Ph.D. and Cheryl D. Dawes. Provided by: Wenatchee Valley College. Located at: https://commons.wvc.edu/rdawes/G101OCL/Basics/mapkey.html. Project: Geology 101 - Introduction to Physical Geology. License: CC BY: Attribution
- Loihi Bathemetric. Authored by: NOAA. Located at: https://commons.wikimedia.org/wiki/File:LoihiBathemetric.jpg. License: Public Domain: No Known Copyright