Learning Outcome
- Graph a linear function using the slope and y-intercept
Another way to graph a linear function is by using its slope m and y-intercept.
Let us consider the following function.
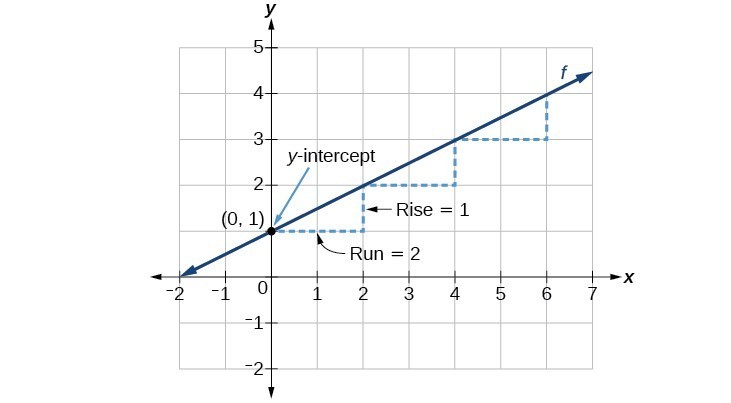
[latex]f\left(x\right)=\dfrac{1}{2}x+1[/latex]
The function is in slope-intercept form, so the slope is [latex]\dfrac{1}{2}[/latex]. Because the slope is positive, we know the graph will slant upward from left to right. The y-intercept is the point on the graph when [latex]x=0[/latex]. The graph crosses the y-axis at [latex](0, 1)[/latex]. Now we know the slope and the y-intercept. We can begin graphing by plotting the point [latex](0, 1)[/latex]. We know that the slope is rise over run, [latex]m=\dfrac{\text{rise}}{\text{run}}[/latex]. From our example, we have [latex]m=\dfrac{1}{2}[/latex], which means that the rise is [latex]1[/latex] and the run is [latex]2[/latex]. So starting from our y-intercept [latex](0, 1)[/latex], we can rise [latex]1[/latex] and then run [latex]2[/latex], or run [latex]2[/latex] and then rise [latex]1[/latex]. We repeat until we have a few points and then we draw a line through the points as shown in the graph below.
A General Note: Graphical Interpretation of a Linear Function
In the equation [latex]f\left(x\right)=mx+b[/latex]
- b is the y-intercept of the graph and indicates the point (0, b) at which the graph crosses the y-axis.
- m is the slope of the line and indicates the vertical displacement (rise) and horizontal displacement (run) between each successive pair of points. Recall the formula for the slope:
[latex]m=\dfrac{\text{change in output (rise)}}{\text{change in input (run)}}=\dfrac{\Delta y}{\Delta x}=\dfrac{{y}_{2}-{y}_{1}}{{x}_{2}-{x}_{1}}[/latex]
All linear functions cross the y-axis and therefore have y-intercepts. (Note: A vertical line parallel to the y-axis does not have a y-intercept, but it is not a function.)
How To: Given the equation for a linear function, graph the function using the y-intercept and slope
- Evaluate the function at an input value of zero to find the y-intercept.
- Identify the slope.
- Plot the point represented by the y-intercept.
- Use [latex]\dfrac{\text{rise}}{\text{run}}[/latex] to determine at least two more points on the line.
- Sketch the line that passes through the points.
Example
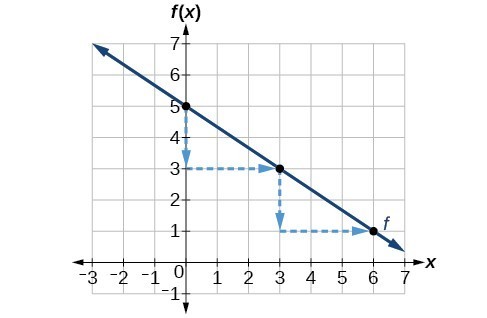
Graph [latex]f\left(x\right)=-\dfrac{2}{3}x+5[/latex] using the y-intercept and slope.
Try It
In the following video we show another example of how to graph a linear function given the y-intercepts and the slope.
In the last example, we will show how to graph another linear function using the slope and y-intercept.
Example
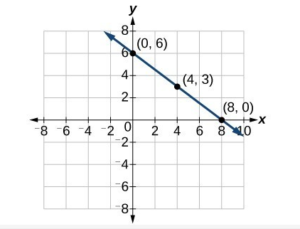
Graph [latex]f\left(x\right)=-\dfrac{3}{4}x+6[/latex] using the slope and y-intercept.
Candela Citations
- Revision and Adaptation. Provided by: Lumen Learning. License: CC BY: Attribution
- Ex: Graph a Line and ID the Slope and Intercepts (Fraction Slope). Authored by: James Sousa (Mathispower4u.com) . Located at: https://youtu.be/N6lEPh11gk8. License: CC BY: Attribution
- QID 79774: Graph linear eq. in slope-intercept form, give slope and intercept.. Authored by: Day, Alyson. License: CC BY: Attribution
- Precalculus. Authored by: Jay Abramson, et al.. Provided by: OpenStax. Located at: http://cnx.org/contents/fd53eae1-fa23-47c7-bb1b-972349835c3c@5.175. License: CC BY: Attribution. License Terms: Download For Free at : http://cnx.org/contents/fd53eae1-fa23-47c7-bb1b-972349835c3c@5.175.