Learning Outcomes
- Recognize when an ordered pair is a y-intercept or an x-intercept
- Graph a linear equation using x and y-intercepts
Intercepts
The intercepts of a line are the points where the line intersects or crosses the horizontal and vertical axes. To help you remember what “intercept” means, think about the word “intersect.” The two words sound alike and in this case mean the same thing.
The straight line on the graph below intersects the two coordinate axes. The point where the line crosses the x-axis is called the x-intercept. The y-intercept is the point where the line crosses the y-axis.
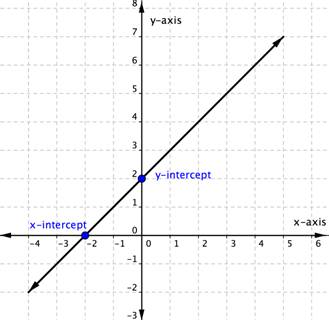
The x-intercept above is the point [latex](−2,0)[/latex]. The y-intercept above is the point ([latex]0, 2[/latex]).
Notice that the y-intercept always occurs where [latex]x=0[/latex], and the x-intercept always occurs where [latex]y=0[/latex].
To find the x and y-intercepts of a linear equation, you can substitute [latex]0[/latex] for y and for x respectively.
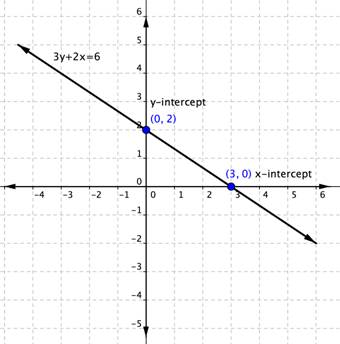
For example, the linear equation [latex]3y+2x=6[/latex] has an x intercept when [latex]y=0[/latex], so [latex]3\left(0\right)+2x=6[/latex].
[latex]\begin{array}{r}2x=6\\x=3\end{array}[/latex]
The x-intercept is [latex](3,0)[/latex].
Likewise, the y-intercept occurs when [latex]x=0[/latex].
[latex]\begin{array}{r}3y+2\left(0\right)=6\\3y=6\\y=2\end{array}[/latex]
The y-intercept is [latex](0,2)[/latex].
Using Intercepts to Graph Lines
You can use intercepts to graph linear equations. Once you have found the two intercepts, draw a line through them.
Do this with the equation [latex]3y+2x=6[/latex]. You figured out that the intercepts of the line this equation represents are [latex](0,2)[/latex] and [latex](3,0)[/latex]. That is all you need to know.
Example
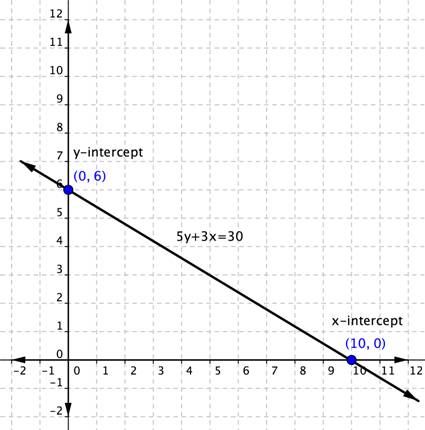
Graph [latex]5y+3x=30[/latex] using the x and y-intercepts.
Example
Graph [latex]y=2x-4[/latex] using the x and y-intercepts.