Most graphing calculators require similar techniques to graph an equation. The equations sometimes have to be manipulated so they are written in the style y=_____. The TI-84 Plus, and many other calculator makes and models, have a mode function, which allows the window (the screen for viewing the graph) to be altered so the pertinent parts of a graph can be seen.
For example, the equation [latex]y=2x - 20[/latex] has been entered in the TI-84 Plus shown in Figure 9a. In Figure 9b, the resulting graph is shown. Notice that we cannot see on the screen where the graph crosses the axes. The standard window screen on the TI-84 Plus shows [latex]-10\le x\le 10[/latex], and [latex]-10\le y\le 10[/latex]. See Figure 9c.
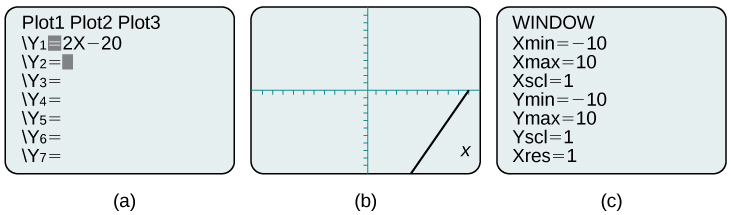
Figure 9 a. Enter the equation. b. This is the graph in the original window. c. These are the original settings.
By changing the window to show more of the positive x-axis and more of the negative y-axis, we have a much better view of the graph and the x- and y-intercepts. See Figure 10a and Figure 10b.
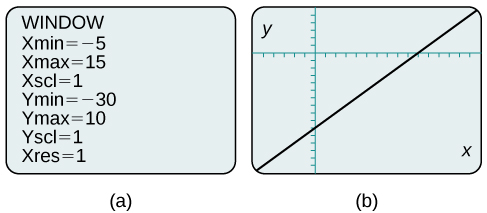
Figure 10 a. This screen shows the new window settings. b. We can clearly view the intercepts in the new window.
Example 3: Using a Graphing Utility to Graph an Equation
Use a graphing utility to graph the equation: [latex]y=-\frac{2}{3}x-\frac{4}{3}\\[/latex].
Solution
Enter the equation in the y= function of the calculator. Set the window settings so that both the x- and y- intercepts are showing in the window.
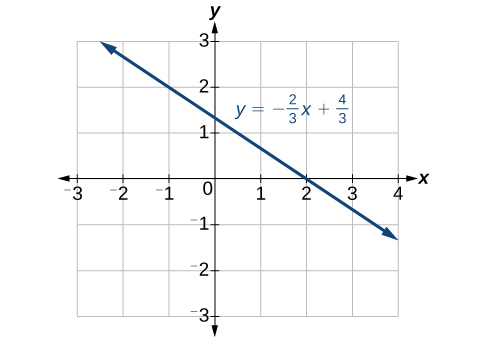
Figure 11
Candela Citations
- College Algebra. Authored by: OpenStax College Algebra. Provided by: OpenStax. Located at: http://cnx.org/contents/9b08c294-057f-4201-9f48-5d6ad992740d@3.278:1/Preface. License: CC BY: Attribution