There is a difference between locating the highest and lowest points on a graph in a region around an open interval (locally) and locating the highest and lowest points on the graph for the entire domain. The [latex]y\text{-}[/latex] coordinates (output) at the highest and lowest points are called the absolute maximum and absolute minimum, respectively.
To locate absolute maxima and minima from a graph, we need to observe the graph to determine where the graph attains it highest and lowest points on the domain of the function. See Figure 10.
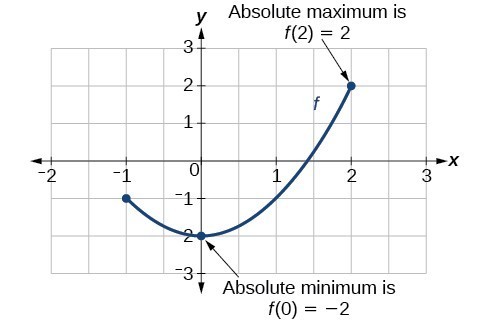
Figure 10
Not every function has an absolute maximum or minimum value. The toolkit function [latex]f\left(x\right)={x}^{3}[/latex] is one such function.
A General Note: Absolute Maxima and Minima
The absolute maximum of [latex]f[/latex] at [latex]x=c[/latex] is [latex]f\left(c\right)[/latex] where [latex]f\left(c\right)\ge f\left(x\right)[/latex] for all [latex]x[/latex] in the domain of [latex]f[/latex].
The absolute minimum of [latex]f[/latex] at [latex]x=d[/latex] is [latex]f\left(d\right)[/latex] where [latex]f\left(d\right)\le f\left(x\right)[/latex] for all [latex]x[/latex] in the domain of [latex]f[/latex].
Example 10: Finding Absolute Maxima and Minima from a Graph
For the function [latex]f[/latex] shown in Figure 11, find all absolute maxima and minima.
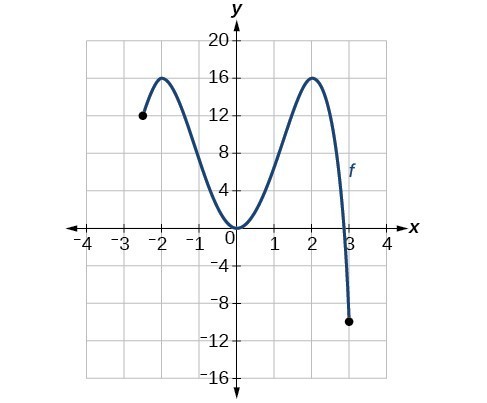
Figure 11
Solution
Observe the graph of [latex]f[/latex]. The graph attains an absolute maximum in two locations, [latex]x=-2[/latex] and [latex]x=2[/latex], because at these locations, the graph attains its highest point on the domain of the function. The absolute maximum is the y-coordinate at [latex]x=-2[/latex] and [latex]x=2[/latex], which is [latex]16[/latex].
The graph attains an absolute minimum at [latex]x=3[/latex], because it is the lowest point on the domain of the function’s graph. The absolute minimum is the y-coordinate at [latex]x=3[/latex], which is [latex]-10[/latex].
Candela Citations
- Precalculus. Authored by: Jay Abramson, et al.. Provided by: OpenStax. Located at: http://cnx.org/contents/fd53eae1-fa23-47c7-bb1b-972349835c3c@5.175. License: CC BY: Attribution. License Terms: Download For Free at : http://cnx.org/contents/fd53eae1-fa23-47c7-bb1b-972349835c3c@5.175.