Learning Objectives
- Determine whether equations are linear or nonlinear.
- Graph linear functions.
- Given a linear equation, determine the slope and [latex]y[/latex]-intercept, if they exist.
- Find the slope given a pair of points, if it exists.
- Given the slope of a line and a point on a line, write the equation of the line.
- Given two points on a line, write the equation of the line.
- Given a point on a line and the equation of a parallel line, write the equation of the line.
- Given a point on a line and the equation of a perpendicular line, write the equation of the line.
This section is a review of skills and concepts from your Beginning Algebra course. Feel free to skim the explanations and try the examples, or to work on the homework and come back for more help. If you find that you need more help understanding slope, please click on the link to learn more about slope.
Determine whether equations are linear or nonlinear
When you graph a linear equation, it forms a straight line on the coordinate plane. Linear equations have a constant rate of change which is called the slope. In contrast, nonlinear equations have graphs that do not form straight lines. The rate of change of a nonlinear function is not constant.
linear vs. non-linear functions
| Linear | Non-linear |
|---|---|
| A function that can be written in the form [latex]f(x)=mx+b[/latex] | A function that CANNOT be written in the form [latex]f(x)=mx+b[/latex] |
| Each variable in the function has a maximum of degree 1. | At least one variable has a degree of 2 or more, or a variable appears in the denominator, or a variable is inside a square root or in an exponent (as a few examples) |
| The function when graphed is a straight line. | The function when graphed is not a straight line but is a curve. |
Examples:
|
Examples:
|
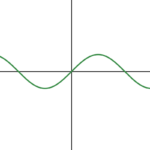
nonlinear function |
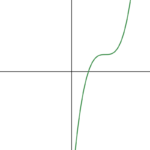
nonlinear function |
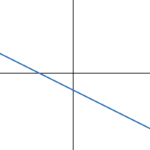
linear function |
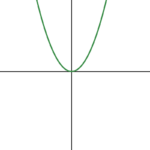
nonlinear function |
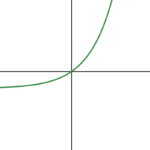
nonlinear function |
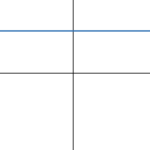
linear function |
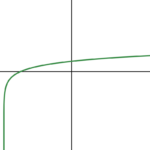
nonlinear function |
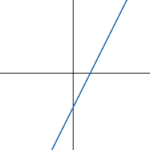
linear function |
Graphing Linear Functions
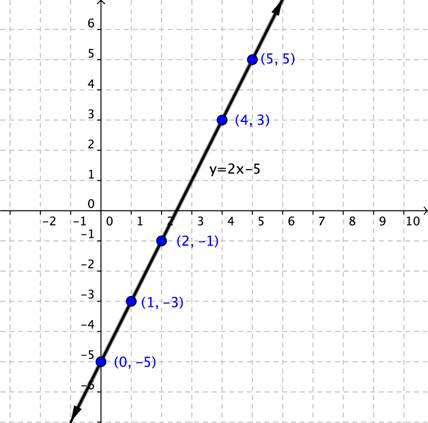
There are multiple ways to create a graph from a linear equation. One way is to create a table of values for [latex]x[/latex] and [latex]y[/latex] and then plot these ordered pairs on the coordinate plane. Two points are enough to determine a line. However, it is always a good idea to plot more than two points to avoid possible errors.
After graphing the points, draw a line through the points to show that all of the points are on the line. The arrows at each end of the graph indicate that the line continues endlessly in both directions. Every point on this line is a solution to the linear equation.
Example
Graph the linear equation [latex]y=2x-5[/latex].
To determine whether an ordered pair is a solution of a linear equation, substitute the [latex]x[/latex] and [latex]y[/latex] values into the equation. If this results in a true statement, then the ordered pair is a solution of the linear equation. If the result is not a true statement then the ordered pair is not a solution.
Example
Determine whether [latex](−2,4)[/latex] is a solution to the linear equation [latex]4y+5x=3[/latex].
Below is a video further explaining how to determine if an ordered pair is a solution to a linear equation.
Intercepts
The intercepts are the points where the graph of the line intersects or crosses the horizontal and vertical axes. To help you remember what “intercept” means, think about the word “intersect.” The two words sound alike and in this case mean the same thing.
The straight line on the graph below intersects the two coordinate axes. The point where the line crosses the [latex]x[/latex]-axis is called the [latex]x[/latex]-intercept. The [latex]y[/latex]-intercept is the point where the line crosses the [latex]y[/latex]-axis. For this graph, the [latex]x[/latex]-intercept is the point [latex](−2,0)[/latex] and the [latex]y[/latex]-intercept is the point ([latex]0, 2[/latex]). The equation of the line below is [latex]x-y=-2[/latex]. If you substitute [latex]0[/latex] in place of [latex]y[/latex], you find [latex]x[/latex] to be [latex]2[/latex], which is the [latex]x[/latex]-intercept of [latex](0,2)[/latex]. If you substitute [latex]0[/latex] in place of [latex]y[/latex], you find [latex]x[/latex] to be [latex]-2[/latex], which is the [latex]y[/latex]-intercept [latex](-2,0)[/latex].
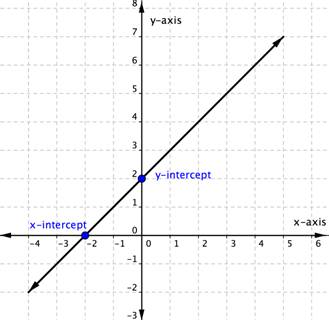
Notice that the [latex]y[/latex]-intercept always occurs where [latex]x=0[/latex], and the [latex]x[/latex]-intercept always occurs where [latex]y=0[/latex]. To find the [latex]x[/latex]– and [latex]y[/latex]-intercepts of a linear equation, you can substitute [latex]0[/latex] for [latex]y[/latex] and for [latex]x[/latex], respectively.
For example, the linear equation [latex]3y+2x=6[/latex] has an [latex]x[/latex]–intercept when [latex]\color{green}{y=0}[/latex]
[latex]\begin{align}3\left(\color{green}{0}\right)+2x&=6\\2x&=6\\x&=3\end{align}[/latex]
The [latex]x[/latex]-intercept is [latex](3,0)[/latex].
Likewise, the [latex]y[/latex]-intercept occurs when [latex]\color{blue}{x=0}[/latex]
[latex]\begin{align}3y+2\left(\color{blue}{0}\right)&=6\\3y&=6\\y&=2\end{align}[/latex]
The [latex]y[/latex]-intercept is [latex](0,2)[/latex].
Using Intercepts to Graph Lines
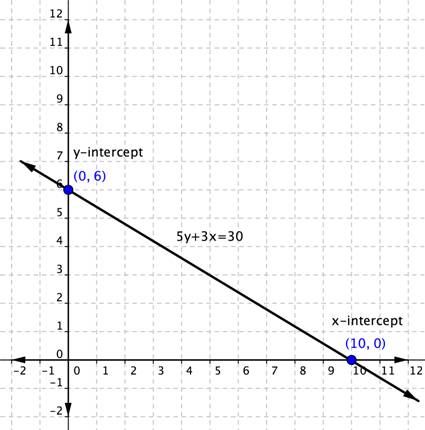
Intercepts can be used to graph linear equations. Once you have found the two intercepts, draw a line through them.
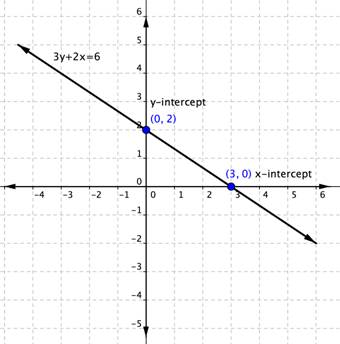
Do this with the equation [latex]3y+2x=6[/latex]. We found that the intercepts of the line this equation represents are [latex](0,2)[/latex] and [latex](3,0)[/latex]. Plot those two points and draw a line through them.
Example
Graph [latex]5y+3x=30[/latex] using the [latex]x[/latex]– and [latex]y[/latex]-intercepts.
This video demonstrates graphing a linear equation using the intercepts.
Example
Graph [latex]y=2x-4[/latex] using the [latex]x[/latex] and [latex]y[/latex]-intercepts.
Finding slope
Given two values for the input, [latex]{x}_{1}[/latex] and [latex]{x}_{2}[/latex], and two corresponding values for the output, [latex]{y}_{1}[/latex] and [latex]{y}_{2}[/latex], represented by a set of ordered pairs, [latex]\left({x}_{1}\text{, }{y}_{1}\right)[/latex] and [latex]\left({x}_{2}\text{, }{y}_{2}\right)[/latex], we can calculate the slope [latex]m[/latex] of a line through those points by
[latex]m=\dfrac{\text{change in output (rise)}}{\text{change in input (run)}}=\dfrac{\Delta y}{\Delta x}=\dfrac{{y}_{2}-{y}_{1}}{{x}_{2}-{x}_{1}}[/latex]
where [latex]\Delta y[/latex] is the vertical displacement and [latex]\Delta x[/latex] is the horizontal displacement.
The graph below indicates how the slope of the line between the points, [latex]\left({x}_{1,}{y}_{1}\right)[/latex] and [latex]\left({x}_{2,}{y}_{2}\right)[/latex] is calculated. The greater the absolute value of the slope, the “steeper” the line is.

The units for slope are always [latex]\dfrac{\text{units for the output}}{\text{units for the input}}[/latex]. Think of the units as the change in output value for each unit of change in input value. An example of slope could be miles per hour or dollars per day. Notice the units appear as a ratio of units for the output per units for the input.
Calculating Slope
The slope [latex]m[/latex], or rate of change of a linear function between two points [latex]\left({x}_{2,\text{ }}{y}_{2}\right)[/latex] and [latex]\left({x}_{1},\text{ }{y}_{1}\right)[/latex] is:
[latex]m=\dfrac{\text{change in output (rise)}}{\text{change in input (run)}}=\dfrac{\Delta y}{\Delta x}=\dfrac{{y}_{2}-{y}_{1}}{{x}_{2}-{x}_{1}}[/latex]
In the following video we show examples of how to find the slope of a line passing through two points.
Example
The population of a city increased from [latex]23,400[/latex] to [latex]27,800[/latex] between [latex]2008[/latex] and [latex]2012[/latex]. Find the change in population per year if we assume the change was constant from [latex]2008[/latex] to [latex]2012[/latex].
In the next video, we show an example where we determine the increase in cost for producing solar panels given two data points.
The slope and y-intercept of a linear equation
Another way to graph a linear function is by using its slope [latex]m[/latex] and [latex]y[/latex]-intercept.
SLOPE-INTERCEPT Form
The linear equation [latex]y=mx+b[/latex] is in slope-intercept form.
- [latex]b[/latex] is the [latex]y[/latex]-intercept of the graph and indicates the point [latex](0,b)[/latex] at which the graph crosses the [latex]y[/latex]-axis.
- [latex]m[/latex] is the slope of the line and indicates the vertical displacement (rise) and horizontal displacement (run) between each successive pair of points. Recall the formula for the slope:
[latex]m=\dfrac{\text{change in output (rise)}}{\text{change in input (run)}}=\dfrac{\Delta y}{\Delta x}=\dfrac{{y}_{2}-{y}_{1}}{{x}_{2}-{x}_{1}}[/latex]
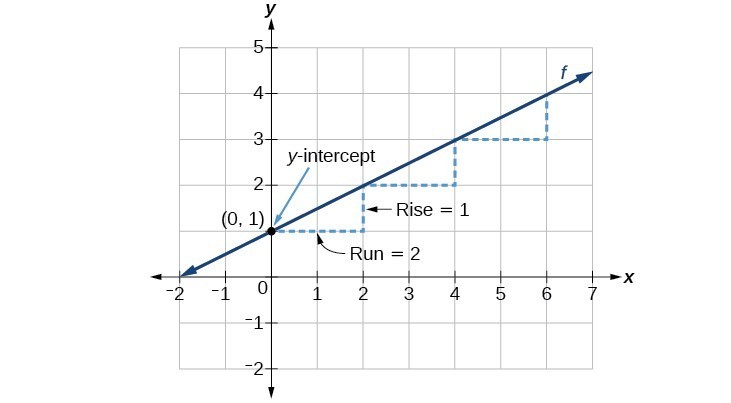
Consider the function [latex]f\left(x\right)=\dfrac{1}{2}x+1[/latex]. The function is in slope-intercept form, so the slope is [latex]m=\dfrac{1}{2}[/latex]. Because the slope is positive, we know the graph will slant upward from left to right. The [latex]y[/latex]–intercept is the point on the graph where [latex]x=0[/latex]. The graph of this line crosses the [latex]y[/latex]-axis at [latex](0, 1)[/latex]. Begin graphing by plotting the point [latex](0, 1)[/latex]. The slope is [latex]m=\dfrac{\text{rise}}{\text{run}}[/latex], so for [latex]m=\dfrac{1}{2}[/latex], the “rise” is [latex]1[/latex] and the “run” from left to right is [latex]2[/latex]. Then starting from the [latex]y[/latex]–intercept [latex](0, 1)[/latex], “rise” [latex]1[/latex] unit and “run” [latex]2[/latex] units to the right. (This is equivalent to “run” [latex]2[/latex] units to the right and then “rise” [latex]1[/latex] unit.) Repeat until you have a few points and then draw a line through the points as shown in the graph below.
Example
Graph [latex]f\left(x\right)=-\dfrac{2}{3}x+5[/latex] using the [latex]y[/latex]–intercept and slope.
Try It
In the following video we show another example of how to graph a linear function given the y-intercepts and the slope.
In the following video, we show an example of how to write the equation of a line given its graph.
Point-Slope Form
If we have the slope of a line and a point on the line, we can write the equation of the line.
Point-Slope Form
Given a point [latex]\left({x}_{1},{y}_{1}\right)[/latex] on a line and the slope of the line, [latex]m[/latex], point-slope form will give the following equation of a line: [latex]y-{y}_{1}=m\left(x-{x}_{1}\right)[/latex]
In this example, we will start with a given slope.
Example
Write the equation of the line with slope [latex]m=-3[/latex] that passes through the point [latex]\left(4,8\right)[/latex]. Write the final equation in slope-intercept form.
The following video shows an example of how to write the equation for a line given its slope and a point on the line.
Finding the Equation of a Line Given Two Points
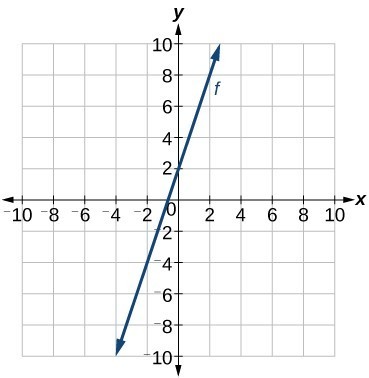
If we start with two points, we can first find the slope of a line through those two points, and then find the equation of the line that passes through them.
Example
Write an equation for a linear function [latex]f[/latex] given its graph shown below.
Example
Find the equation of the line that passes through the points [latex]\left(\color{blue}{3,4}\right)[/latex] and [latex]\left(\color{green}{0,-3}\right)[/latex]. Write the final equation in slope-intercept form.
The next video shows another example of writing the equation of a line given two points on the line.
Vertical and Horizontal Lines
Vertical Lines
The equation of a vertical line is given as [latex]x=c[/latex] where [latex]c[/latex] is a constant. The slope of a vertical line is undefined, and regardless of the [latex]y[/latex]–value of any point on the line, the [latex]x[/latex]–coordinate of the point will be [latex]c[/latex].
Suppose that we want to find the equation of a line containing the following points: [latex]\left(-3,-5\right),\left(-3,1\right),\left(-3,3\right)[/latex], and [latex]\left(-3,5\right)[/latex]. First, we will find the slope, choosing two of the given points. In this case, we are choosing the points [latex](-3,3)[/latex] and [latex](-3,5)[/latex].
[latex]m=\dfrac{5 - 3}{-3-\left(-3\right)}=\dfrac{2}{0}[/latex]
Dividing by zero is undefined so the slope of the line through these points is undefined. Using point-slope form is not possible. Notice that all of the [latex]x[/latex]–coordinates in the given ordered pairs are the same. Then a vertical line through these points is [latex]x=-3[/latex]. The line is on the graph below.
Horizontal Lines
The equation of a horizontal line is given as [latex]y=c[/latex] where [latex]c[/latex] is a constant. The slope of a horizontal line is zero, and for any [latex]x[/latex]–value of a point on the line, the corresponding [latex]y[/latex]–coordinate will be [latex]c[/latex].
Suppose we want to find the equation of a line that contains the following points: [latex]\left(-2,-2\right),\left(0,-2\right),\left(3,-2\right)[/latex], and [latex]\left(5,-2\right)[/latex]. We can use point-slope form to find the equation of the line. First, we find the slope using any two points on the line. In this case, we are choosing [latex](-2,-2)[/latex] and [latex](0,-2)[/latex].
[latex]\begin{align}m&=\dfrac{-2-\left(-2\right)}{0-\left(-2\right)}\\&=\dfrac{0}{2}\\&=0\end{align}[/latex]
Use any point for [latex]\left({x}_{1},{y}_{1}\right)[/latex] in point-slope form.
[latex]\begin{align}y-\left(-2\right)&=0\left(x - 3\right)\\y+2&=0\\ y&=-2\end{align}[/latex]
The graph (below) is a horizontal line [latex]y=-2[/latex]. Notice that all of the [latex]y[/latex]–coordinates are the same in the list of ordered pairs.
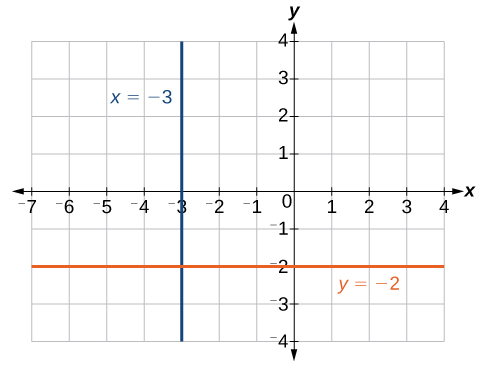
The line [latex]x=−3[/latex] is a vertical line. The line [latex]y=−2[/latex] is a horizontal line.
Example
Write the equation of the line that passes through the points [latex]\left(1,-3\right)[/latex] and [latex]\left(1,4\right).[/latex]
Graphing a Linear Function: Another Approach
Another option for graphing linear functions is to use a vertical shift of the function.
Vertical Shift
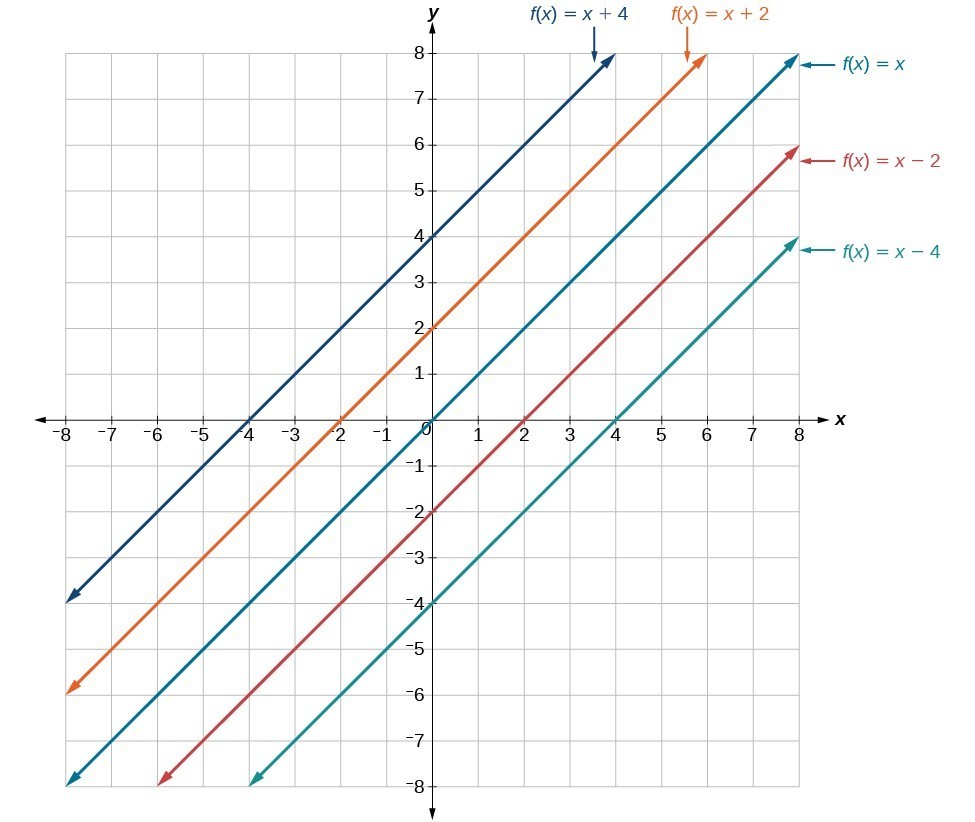
In a linear function [latex]f\left(x\right)=mx+b[/latex], the [latex]b[/latex] acts as the vertical shift, moving the graph up and down without affecting the slope of the line. Notice in the figure below that adding a value of [latex]b[/latex] to the equation of [latex]f\left(x\right)=x[/latex] shifts the graph of [latex]f[/latex] a total of [latex]b[/latex] units up if [latex]b[/latex] is positive and [latex]|b|[/latex] units down if [latex]b[/latex] is negative. The graph below illustrates vertical shifts of the linear function [latex]f\left(x\right)=x[/latex].
In this next example, we will start with the function [latex]f(x)=\dfrac{1}{2}x[/latex] and use a vertical shift to graph [latex]f\left(x\right)=\dfrac{1}{2}x - 3[/latex].
Example
Graph [latex]f\left(x\right)=\dfrac{1}{2}x - 3[/latex].
Write the equation of a line given a point and a parallel or perpendicular line
The relationships between slopes of parallel and perpendicular lines can be used to write equations of parallel and perpendicular lines.
Let’s start with an example involving parallel lines. Parallel lines have the same slope.
Write the equation of a line given a point and a parallel line
Example
Write the equation of a line that is parallel to the line [latex]x–y=5[/latex] and passes through the point [latex](−2,1)[/latex].
Write the equation of a line given a point and a perpendicular line
When you are working with perpendicular lines, you will usually be given one of the lines and an additional point. Remember that two non-vertical lines are perpendicular if the slope of one is the opposite reciprocal of the slope of the other. To find the slope of a perpendicular line, find the reciprocal, and then find the opposite of this reciprocal. In other words, flip it and change the sign.
Example
Write the equation of a line that passes through the point [latex](1,5)[/latex] and is perpendicular to the line [latex]y=2x– 6[/latex].
Video: Write the equation of a line given a point and a perpendicular line (Alternate Method)
Write the equations of lines parallel and perpendicular to horizontal and vertical lines
Example
Write the equation of a line that is parallel to the line [latex]y=4[/latex] and passes through the point [latex](0,10)[/latex].
Example
Write the equation of a line that is perpendicular to the line [latex]y=-3[/latex] and passes through the point [latex](-2,5)[/latex].
Summary
The slope-intercept form of a linear equation is written as [latex]y=mx+b[/latex], where [latex]m[/latex] is the slope and [latex]y[/latex] is the value of [latex]y[/latex] at the [latex]y[/latex]-intercept, which can be written as [latex](0,b)[/latex]. When you know the slope and the [latex]y[/latex]-intercept of a line you can use the slope-intercept form to immediately write the equation of that line. The point-slope form, [latex]y-{y}_{1}=m\left(x-{x}_{1}\right)[/latex], can be used to write the equation of a line when you know the slope and a point on the line or when you know two points on the line.
When lines in a plane are parallel (that is, they never cross), they have the same slope. When lines are perpendicular (that is, they cross at a 90° angle), their slopes are opposite reciprocals of each other. The product of their slopes will be [latex]-1[/latex], except in the case where one of the lines is vertical causing its slope to be undefined. You can use these relationships to find an equation of a line that goes through a particular point and is parallel or perpendicular to another line.
