section 3.4 Learning Objectives
3.4: Slope of a Line
- Identify the slope of a line from the graph
- Find the slope of a line given two points on a line
- Find the slope and y-intercept given the equation of a line
- Find the slope of horizontal and vertical lines
- Find the slopes of parallel and perpendicular lines
- Graph a line using the slope and y-intercept
Identify slope from a graph
The mathematical definition of slope is very similar to our everyday one. In math, slope is used to describe the steepness and direction of lines. By just looking at the graph of a line, you can learn some things about its slope, especially relative to other lines graphed on the same coordinate plane. Consider the graphs of the three lines shown below:
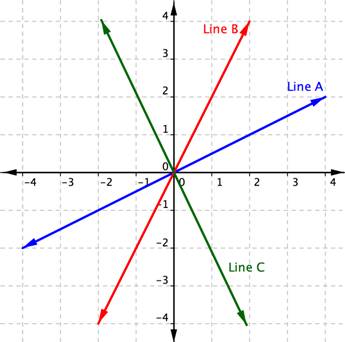
First, let’s look at lines A and B. If you imagined these lines to be hills, you would say that line B is steeper than line A. Line B has a greater slope than line A.
Next, notice that lines A and B slant up as you move from left to right. We say these two lines have a positive slope. Line C slants down from left to right. Line C has a negative slope. Using two of the points on the line, you can find the slope of the line by finding the rise and the run. The vertical change between two points is called the rise, and the horizontal change is called the run. The slope equals the rise divided by the run: [latex]\displaystyle \text{Slope }=\frac{\text{rise}}{\text{run}}[/latex].
You can determine the slope of a line from its graph by looking at the rise and run. One characteristic of a line is that its slope is constant all the way along it. So, you can choose any 2 points along the graph of the line to figure out the slope. Let’s look at an example.
Example 1
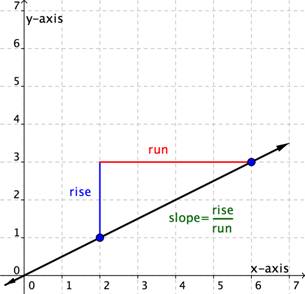
Use the graph to find the slope of the line.
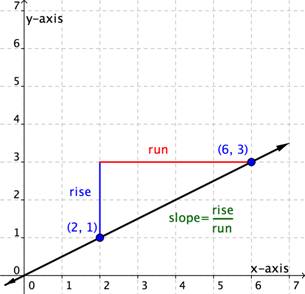
This line will have a slope of [latex]\displaystyle \frac{1}{2}[/latex] no matter which two points you pick on the line. Try measuring the slope from the origin, [latex](0,0)[/latex], to the point [latex](6,3)[/latex]. You will find that the [latex]\text{rise}=3[/latex] and the [latex]\text{run}=6[/latex]. The slope is [latex]\displaystyle \frac{\text{rise}}{\text{run}}=\frac{3}{6}=\frac{1}{2}[/latex]. It is the same!
Let’s look at another example.
Example 2
Use the graph to find the slope of the two lines.
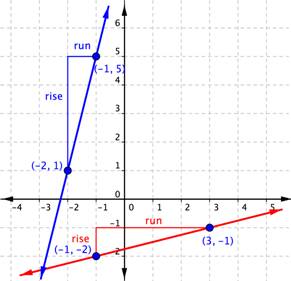
When you look at the two lines, you can see that the blue line is steeper than the red line. It makes sense the value of the slope of the blue line, 4, is greater than the value of the slope of the red line, [latex]\displaystyle \frac{1}{4}[/latex]. The greater the slope, the steeper the line.
Distinguish between graphs of lines with negative and positive slopes
Direction is important when it comes to determining slope. It’s important to pay attention to whether you are moving up, down, left, or right; that is, if you are moving in a positive or negative direction. If you go up to get to your second point, the rise is positive. If you go down to get to your second point, the rise is negative. If you go right to get to your second point, the run is positive. If you go left to get to your second point, the run is negative.
In the following two examples, you will see a slope that is positive and one that is negative.
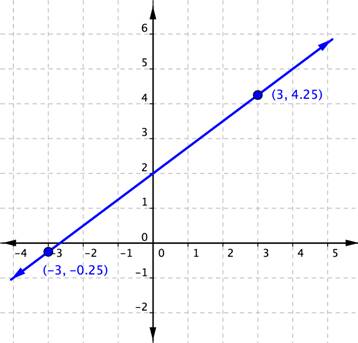
Example 3 (Advanced)
Find the slope of the line graphed below.
The next example shows a line with a negative slope.
Example 4
Find the slope of the line graphed below.
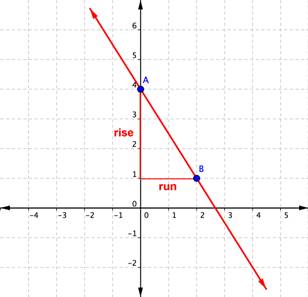
In the example above, you could have also found the slope by starting at point B, rising [latex]+3[/latex] (up) and then running [latex]-2[/latex] (left) to arrive at point A. The result is still a slope of [latex]\displaystyle\frac{\text{rise}}{\text{run}}=\frac{+3}{-2}=-\frac{3}{2}[/latex].
Find the slope given two points on the line
You’ve seen that you can find the slope of a line on a graph by measuring the rise and the run. You can also find the slope of a line without its graph if you know the coordinates of any two points on that line. Every point has a set of coordinates: an x-value and a y-value, written as an ordered pair (x, y). The x-value tells you where a point is horizontally. The y-value tells you where the point is vertically.
Consider two points on a line—Point 1 and Point 2. Point 1 has coordinates [latex]\left(x_{1},y_{1}\right)[/latex] and Point 2 has coordinates [latex]\left(x_{2},y_{2}\right)[/latex].
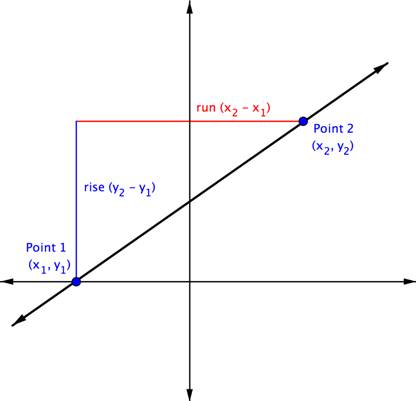
The rise is the vertical change between the two points, which is the difference between their y-coordinates. That makes the rise [latex]\left(y_{2}-y_{1}\right)[/latex]. The run between these two points is the difference in the x-coordinates, or [latex]\left(x_{2}-x_{1}\right)[/latex].
So, [latex]\displaystyle \text{Slope}=\frac{\text{rise}}{\text{run}}[/latex] or [latex]\displaystyle m=\frac{{{y}_{2}}-{{y}_{1}}}{{{x}_{2}}-{{x}_{1}}}[/latex]
In the example below, you’ll see that the line has two points each indicated as an ordered pair. The point [latex](0,2)[/latex] is indicated as Point 1, and [latex](−2,6)[/latex] as Point 2. So you are going to move from Point 1 to Point 2. A triangle is drawn in above the line to help illustrate the rise and run.
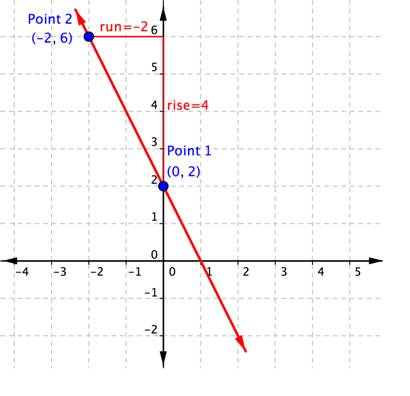
You can see from the graph that the rise going from Point 1 to Point 2 is 4, because you are moving 4 units in a positive direction (up). The run is [latex]−2[/latex], because you are then moving in a negative direction (left) 2 units. Using the slope formula,
[latex]\displaystyle \text{Slope}=\frac{\text{rise}}{\text{run}}=\frac{4}{-2}=-2[/latex].
You do not need the graph to find the slope. You can just use the coordinates, keeping careful track of which is Point 1 and which is Point 2. Let’s organize the information about the two points:
| Name | Ordered Pair | Coordinates |
|---|---|---|
| Point 1 | [latex](0,2)[/latex] | [latex]\begin{array}{l}x_{1}=0\\y_{1}=2\end{array}[/latex] |
| Point 2 | [latex](−2,6)[/latex] | [latex]\begin{array}{l}x_{2}=-2\\y_{2}=6\end{array}[/latex] |
The slope, [latex]m=\frac{y_{2}-y_{1}}{x_{2}-x_{1}}=\frac{6-2}{-2-0}=\frac{4}{-2}=-2[/latex]. The slope of the line, m, is [latex]−2[/latex].
It doesn’t matter which point is designated as Point 1 and which is Point 2. You could have called [latex](−2,6)[/latex] Point 1, and [latex](0,2)[/latex] Point 2. In that case, putting the coordinates into the slope formula produces the equation [latex]m=\frac{2-6}{0-\left(-2\right)}=\frac{-4}{2}=-2[/latex]. Once again, the slope is [latex]m=-2[/latex]. That’s the same slope as before. The important thing is to be consistent when you subtract: you must always subtract in the same order.
Example 5
What is the slope of the line that contains the points [latex](5,5)[/latex] and [latex](4,2)[/latex]?
The example below shows the solution when you reverse the order of the points, calling [latex](5,5)[/latex] Point 1 and [latex](4,2)[/latex] Point 2.
Example 6
What is the slope of the line that contains the points [latex](5,5)[/latex] and [latex](4,2)[/latex]?
Notice that regardless of which ordered pair is named Point 1 and which is named Point 2, the slope is still 3.
Example 7 (Advanced)
What is the slope of the line that contains the points [latex](3,-6.25)[/latex] and [latex](-1,8.5)[/latex]?
Find the slope and y-intercept given the equation of the line:
We can also determine the slope of a line from the equation of the line. To do this, we first need to write the equation in Slope-Intercept Form.
Slope-Intercept Form: [latex]y=mx+b[/latex]
To write an equation in Slope-Intercept Form, we need to solve for [latex]y[/latex] in the equation. Once the equation is in this form, we know a couple of things just by looking at the equation.
The coefficient of [latex]x[/latex] is the slope of the line.
The y-intercept is the point [latex](0,b)[/latex].
Example 8
Find the slope and y-intercept of the line with equation [latex]y=-3x+7[/latex]
Example 9
Find the slope and y-intercept of the line with equation [latex]-4x+2y=-6[/latex]
Example 10
Find the slope and y-intercept of the line with equation [latex]y=\frac{3}{5}x[/latex]:
Find the slope of horizontal and vertical lines
So far you’ve considered lines that run “uphill” or “downhill.” Their slopes may be steep or gradual, but they are always positive or negative numbers. But there are two other kinds of lines, horizontal and vertical. What is the slope of a flat line or level ground? Of a wall or a vertical line?
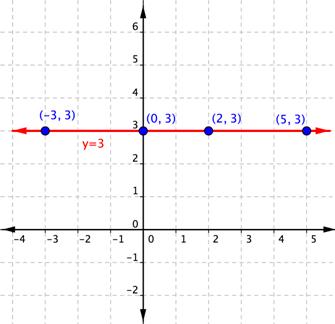
Let’s consider a horizontal line on a graph. No matter which two points you choose on the line, they will always have the same y-coordinate. The equation for this line is [latex]y=3[/latex]. The equation can also be written as [latex]y=\left(0\right)x+3[/latex].
Using the form [latex]y=0x+3[/latex], you can see that the slope is 0. You can also use the slope formula with two points on this horizontal line to calculate the slope of this horizontal line. Using [latex](−3,3)[/latex] as Point 1 and (2, 3) as Point 2, you get:
[latex]\displaystyle \begin{array}{l}m=\frac{{{y}_{2}}-{{y}_{1}}}{{{x}_{2}}-{{x}_{1}}}\\\\m=\frac{3-3}{2-\left(-3\right)}=\frac{0}{5}=0\end{array}[/latex]
The slope of this horizontal line is 0.
Let’s consider any horizontal line. No matter which two points you choose on the line, they will always have the same y-coordinate. So, when you apply the slope formula, the numerator will always be 0. Zero divided by any non-zero number is 0, so the slope of any horizontal line is always 0.
The equation for the horizontal line [latex]y=3[/latex] is telling you that no matter which two points you choose on this line, the y-coordinate will always be 3.
How about vertical lines? In this case, no matter which two points you choose, they will always have the same x-coordinate. The equation for the line shown below is [latex]x=2[/latex].
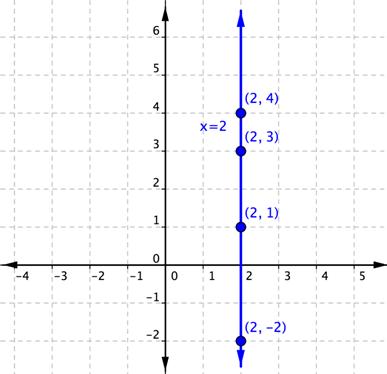
There is no way that this equation can be put in the slope-point form, as the coefficient of y is [latex]0[/latex].
So, what happens when you use the slope formula with two points on this vertical line to calculate the slope? Using [latex](2,1)[/latex] as Point 1 and [latex](2,3)[/latex] as Point 2, you get:
[latex]\displaystyle \begin{array}{l}m=\frac{{{y}_{2}}-{{y}_{1}}}{{{x}_{2}}-{{x}_{1}}}\\\\m=\frac{3-1}{2-2}=\frac{2}{0}\end{array}[/latex]
But division by zero is undefined for the set of real numbers. Because of this fact, it is said that the slope of this vertical line is undefined. This is true for all vertical lines—they all have a slope that is undefined.
Example 11
What is the slope of the line that contains the points [latex](3,2)[/latex] and [latex](−8,2)[/latex]?
Example 12
Find the slope and y-intercept of the line with equation [latex]y=-2[/latex] :
ExAMPLE 13
Find the slope and y-intercept of the line with equation [latex]x=3[/latex]:

Characterize the slopes of parallel and perpendicular lines
When you graph two or more linear equations in a coordinate plane, they generally cross at a point. However, when two lines in a coordinate plane never cross, they are called parallel lines. You will also look at the case where two lines in a coordinate plane cross at a right angle. These are called perpendicular lines. The slopes of the graphs in each of these cases have a special relationship to each other.
Parallel lines are two or more lines in a plane that never intersect. Examples of parallel lines are all around us, such as the opposite sides of a rectangular picture frame and the shelves of a bookcase.
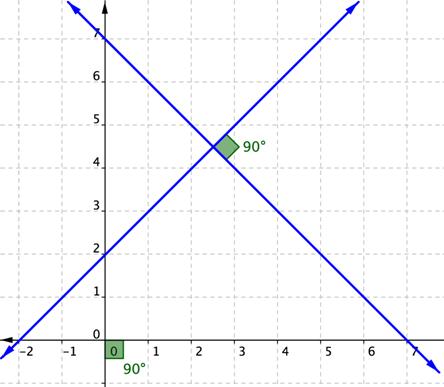
Perpendicular lines are two or more lines that intersect at a 90-degree angle, like the two lines drawn on this graph. These 90-degree angles are also known as right angles.
Perpendicular lines are also everywhere, not just on graph paper but also in the world around us, from the crossing pattern of roads at an intersection to the colored lines of a plaid shirt.
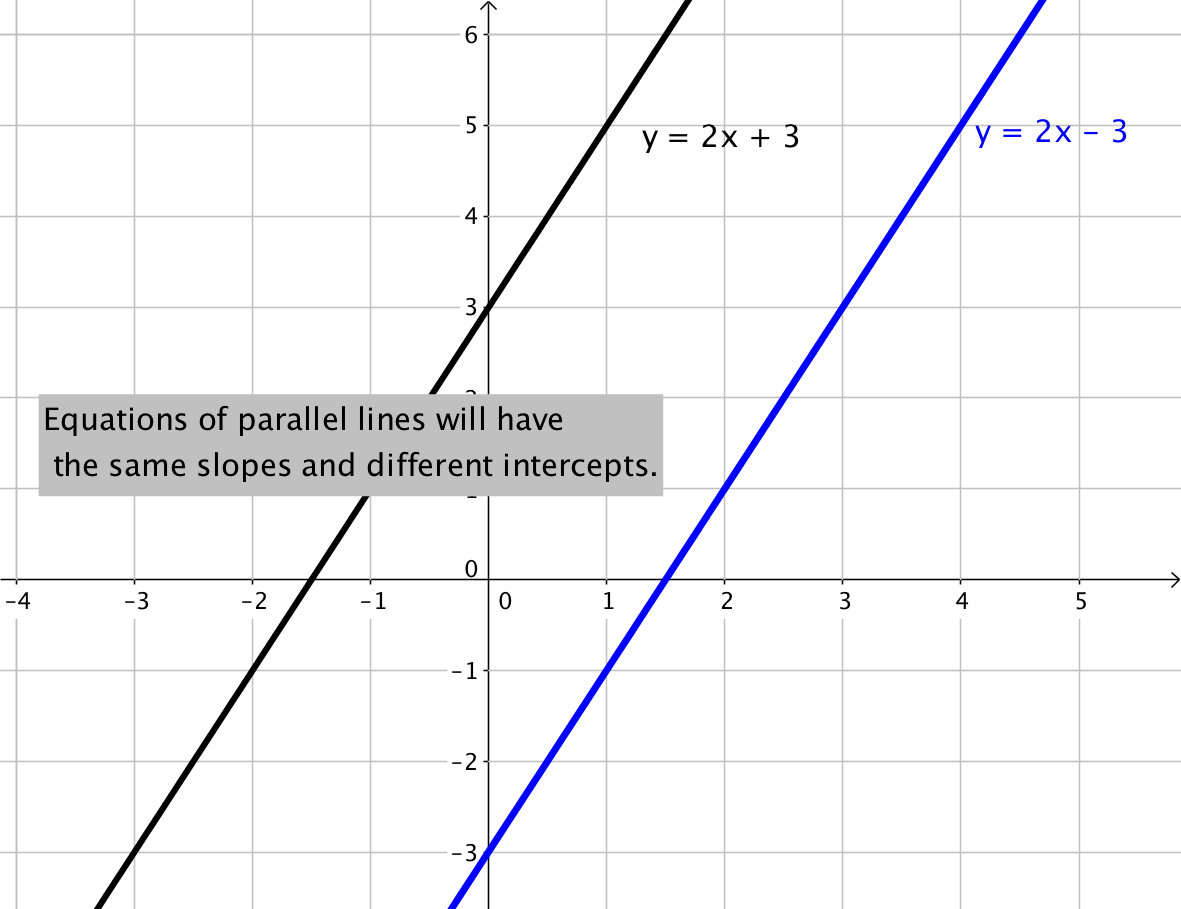
Parallel Lines
Two non-vertical lines in a plane are parallel if they have both:
- the same slope
- different y-intercepts
Any two vertical lines in a plane are parallel.
Find the slopes of parallel lines
Example 14
Find the slope of a line parallel to the line [latex]y=−3x+4[/latex].
Example 15
Determine whether the lines [latex]y=6x+5[/latex] and [latex]y=6x–1[/latex] are parallel.
Find the slopes of perpendicular lines
Perpendicular Lines
Two non-vertical lines are perpendicular if the slope of one is the negative reciprocal of the slope of the other. If the slope of the first equation is [latex]\frac{2}{3}[/latex], then the slope of the second equation will need to be [latex]-\frac{3}{2}[/latex] for the lines to be perpendicular.
You can also check the two slopes to see if the lines are perpendicular by multiplying the two slopes together. If they are perpendicular, the product of the slopes will be [latex]−1[/latex]. For example, [latex]\frac{2}{3}\cdot-\frac{3}{2}=-1[/latex].
Example 16
Find the slope of a line perpendicular to the line [latex]y=2x–6[/latex].
To find the slope of a perpendicular line, find the reciprocal, [latex]\displaystyle \frac{2}{1}[/latex], which is [latex]\frac{1}{2}[/latex],and then find the opposite of this reciprocal, which is [latex]\displaystyle -\tfrac{1}{2}[/latex].
Note that the product [latex]2\left(-\frac{1}{2}\right)=\frac{2}{1}\left(-\frac{1}{2}\right)=-1[/latex], so this means the lines are perpendicular.
In the case where one of the lines is vertical, the slope of that line is undefined and it is not possible to calculate the product with an undefined number. When one line is vertical, the line perpendicular to it will be horizontal, having a slope of zero ([latex]m=0[/latex]).
Example 17
Determine whether the lines [latex]y=−8x+5[/latex] and [latex]\displaystyle y\,\text{=}\,\,\frac{1}{8}x-1[/latex] are parallel, perpendicular, or neither.
In this last example, you will work with an equation of a line given in Standard Form instead of Slope-Intercept Form as the previous examples have been given in.
Example 18
Consider the equation: [latex]8x-5y=10[/latex]
What is the slope of a line that is parallel to the above line?
What is the slope of a line that is perpendicular to the above line?
Graph a line using the slope and y-intercept
Previously we learned how to graph linear equations by finding ordered pairs that are solutions to the equation and then using those points to create a graph of the line. Another option for graphing linear functions is using the slope and y-intercept.
Let us consider the following function.
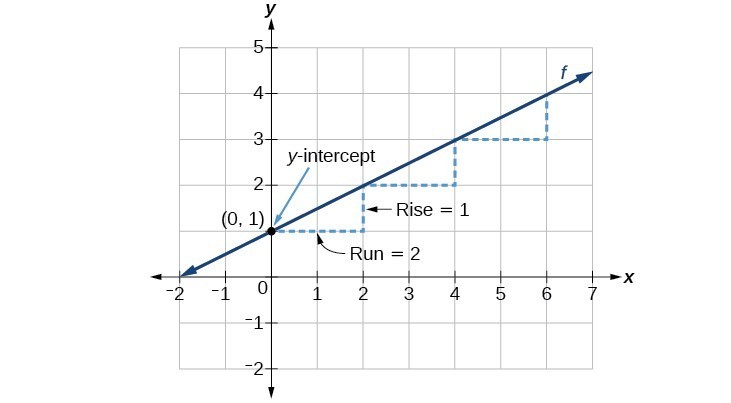
[latex]f\left(x\right)=\dfrac{1}{2}x+1[/latex]
The function is in slope-intercept form. Therefore, we know the slope of the line is [latex]\dfrac{1}{2}[/latex] and the [latex]y[/latex]-intercept is the point [latex](0,1)[/latex]. Next, we will look at the slope.
[latex]slope=\frac{rise}{run}=\frac{1}{2}[/latex]
So, starting from the [latex]y[/latex]-intercept [latex](0,1)[/latex], we can “rise” 1 unit and “run” 2 units to locate a second point on our line. In other words, we will go up 1 unit and to the right 2 units. That brings us to the point [latex](2,2)[/latex]. We can repeat that process from the point [latex](2,2)[/latex] to locate an additional point on the line. Drawing a line through those points creates the graph of our equation.
How To: Given the equation for a linear function, graph the function using the y-intercept and slope
- Evaluate the function at an input value of zero to find the y-intercept. This will always be [latex](0,b)[/latex].
- Identify the slope.
- Plot the point represented by the y-intercept.
- Use [latex]\dfrac{\text{rise}}{\text{run}}[/latex] to determine at least two more points on the line.
- Sketch the line that passes through the points.
Example 19
Graph [latex]f\left(x\right)=-\dfrac{2}{3}x+5[/latex] using the y-intercept and slope.
In the following video we show another example of how to graph a linear function given the y-intercepts and the slope.
In the next example, we will graph another linear function using the slope and [latex]y[/latex]-intercept. However, in this example, the equation is not given in slope-intercept form.
Example 20
Graph [latex]3x+4y=24[/latex] using the slope and y-intercept.
Summary
Slope describes the steepness of a line. The slope of any line remains constant along the line. The slope can also tell you information about the direction of the line on the coordinate plane. Slope can be calculated either by looking at the graph of a line or by using the coordinates of any two points on a line. There are two common formulas for slope: [latex]\displaystyle \text{Slope }=\frac{\text{rise}}{\text{run}}[/latex] and [latex]\displaystyle m=\frac{{{y}_{2}}-{{y}_{1}}}{{{x}_{2}}-{{x}_{1}}}[/latex] where [latex]m=\text{slope}[/latex] and [latex]\displaystyle ({{x}_{1}},{{y}_{1}})[/latex] and [latex]\displaystyle ({{x}_{2}},{{y}_{2}})[/latex] are two points on the line.
The images below summarize the slopes of different types of lines.