QUICK reference
[latex]\displaystyle \text{Slope }=\frac{\text{rise}}{\text{run}}[/latex] and [latex]\displaystyle m=\frac{{{y}_{2}}-{{y}_{1}}}{{{x}_{2}}-{{x}_{1}}}[/latex] where [latex]m=\text{slope}[/latex] and [latex]\displaystyle ({{x}_{1}},{{y}_{1}})[/latex] and [latex]\displaystyle ({{x}_{2}},{{y}_{2}})[/latex] are two points on the line.
[latex]y = mx + b[/latex]
[latex]\begin{array}{l}\,\,\,\,\,m\,\,\,\,=\,\,\,\text{slope}\\(x,y)=\,\,\,\text{a point on the line}\\\,\,\,\,\,\,\,b\,\,\,\,=\,\,\,\text{the y value of the y-intercept}\end{array}[/latex]
Identify slope from a graph
In math, slope is used to describe the steepness and direction of lines. By just looking at the graph of a line, you can learn some things about its slope, especially relative to other lines graphed on the same coordinate plane. Consider the graphs of the three lines shown below:
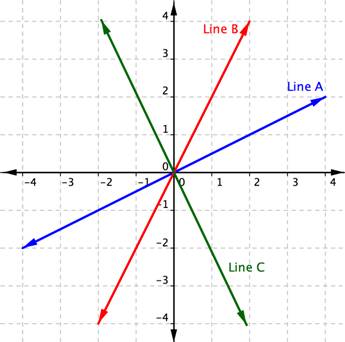
First, let’s look at lines A and B. If you imagined these lines to be hills, you would say that line B is steeper than line A. Line B has a greater slope than line A.
Next, notice that lines A and B slant up as you move from left to right. We say these two lines have a positive slope. Line C slants down from left to right. Line C has a negative slope. Using two of the points on the line, you can find the slope of the line by finding the rise and the run. The vertical change between two points is called the rise, and the horizontal change is called the run. The slope equals the rise divided by the run: [latex]\displaystyle \text{Slope }=\frac{\text{rise}}{\text{run}}[/latex].
You can determine the slope of a line from its graph by looking at the rise and run. One characteristic of a line is that its slope is constant all the way along it. So, you can choose any 2 points along the graph of the line to figure out the slope. Let’s look at an example.
Example
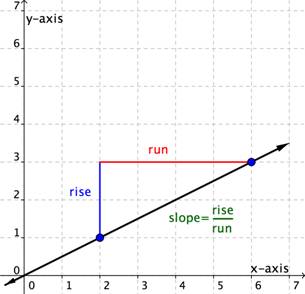
Use the graph to find the slope of the line.
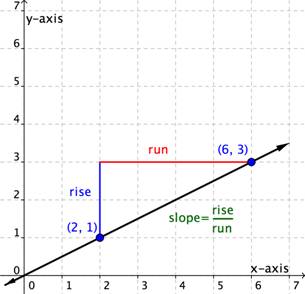
This line will have a slope of [latex]\displaystyle \frac{1}{2}[/latex] no matter which two points you pick on the line. Try measuring the slope from the origin, [latex](0,0)[/latex], to the point [latex](6,3)[/latex]. You will find that the [latex]\text{rise}=3[/latex] and the [latex]\text{run}=6[/latex]. The slope is [latex]\displaystyle \frac{\text{rise}}{\text{run}}=\frac{3}{6}=\frac{1}{2}[/latex]. It is the same!
Let’s look at another example.
Example
Use the graph to find the slope of the two lines.
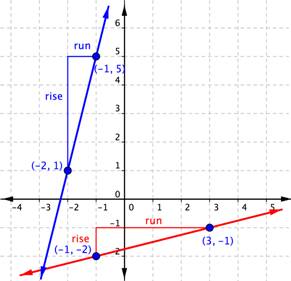
When you look at the two lines, you can see that the blue line is steeper than the red line. It makes sense the value of the slope of the blue line, 4, is greater than the value of the slope of the red line, [latex]\displaystyle \frac{1}{4}[/latex]. The greater the slope, the steeper the line.
Distinguish between graphs of lines with negative and positive slopes
Direction is important when it comes to determining slope. It’s important to pay attention to whether you are moving up, down, left, or right; that is, if you are moving in a positive or negative direction. If you go up to get to your second point, the rise is positive. If you go down to get to your second point, the rise is negative. If you go right to get to your second point, the run is positive. If you go left to get to your second point, the run is negative.
In the following two examples, you will see a slope that is positive and one that is negative.
Example (Advanced)
Find the slope of the line graphed below.
The next example shows a line with a negative slope.
Example
Find the slope of the line graphed below.
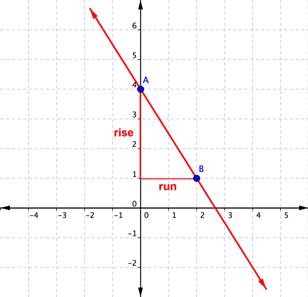
In the example above, you could have found the slope by starting at point B, running [latex]{-2}[/latex], and then rising [latex]+3[/latex] to arrive at point A. The result is still a slope of [latex]\displaystyle\frac{\text{rise}}{\text{run}}=\frac{+3}{-2}=-\frac{3}{2}[/latex].
Finding the Slope from Two Points on the Line
You’ve seen that you can find the slope of a line on a graph by measuring the rise and the run. You can also find the slope of a straight line without its graph if you know the coordinates of any two points on that line. Every point has a set of coordinates: an x-value and a y-value, written as an ordered pair (x, y). The x value tells you where a point is horizontally. The y value tells you where the point is vertically.
Consider two points on a line—Point 1 and Point 2. Point 1 has coordinates [latex]\left(x_{1},y_{1}\right)[/latex] and Point 2 has coordinates [latex]\left(x_{2},y_{2}\right)[/latex].
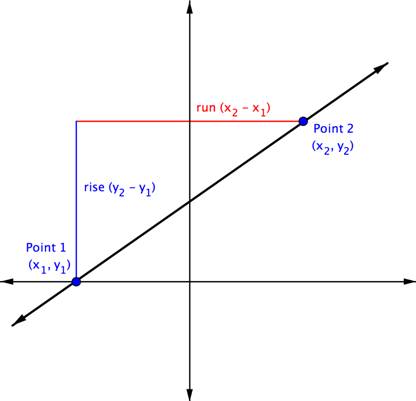
The rise is the vertical distance between the two points, which is the difference between their y-coordinates. That makes the rise [latex]\left(y_{2}-y_{1}\right)[/latex]. The run between these two points is the difference in the x-coordinates, or [latex]\left(x_{2}-x_{1}\right)[/latex].
So, [latex]\displaystyle \text{Slope}=\frac{\text{rise}}{\text{run}}[/latex] or [latex]\displaystyle m=\frac{{{y}_{2}}-{{y}_{1}}}{{{x}_{2}}-{{x}_{1}}}[/latex]
In the example below, you’ll see that the line has two points each indicated as an ordered pair. The point [latex](0,2)[/latex] is indicated as Point 1, and [latex](−2,6)[/latex] as Point 2. So you are going to move from Point 1 to Point 2. A triangle is drawn in above the line to help illustrate the rise and run.
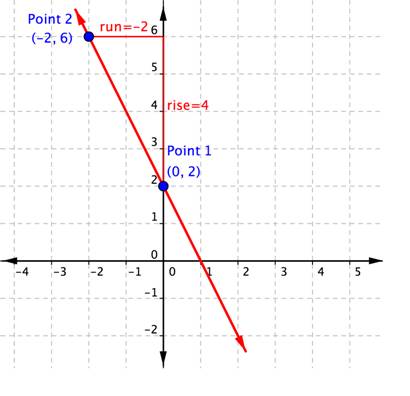
You can see from the graph that the rise going from Point 1 to Point 2 is 4, because you are moving 4 units in a positive direction (up). The run is [latex]−2[/latex], because you are then moving in a negative direction (left) 2 units. Using the slope formula,
[latex]\displaystyle \text{Slope}=\frac{\text{rise}}{\text{run}}=\frac{4}{-2}=-2[/latex].
You do not need the graph to find the slope. You can just use the coordinates, keeping careful track of which is Point 1 and which is Point 2. Let’s organize the information about the two points:
| Name | Ordered Pair | Coordinates |
|---|---|---|
| Point 1 | [latex](0,2)[/latex] | [latex]\begin{array}{l}x_{1}=0\\y_{1}=2\end{array}[/latex] |
| Point 2 | [latex](−2,6)[/latex] | [latex]\begin{array}{l}x_{2}=-2\\y_{2}=6\end{array}[/latex] |
The slope, [latex]m=\frac{y_{2}-y_{1}}{x_{2}-x_{1}}=\frac{6-2}{-2-0}=\frac{4}{-2}=-2[/latex]. The slope of the line, m, is [latex]−2[/latex].
It doesn’t matter which point is designated as Point 1 and which is Point 2. You could have called [latex](−2,6)[/latex] Point 1, and [latex](0,2)[/latex] Point 2. In that case, putting the coordinates into the slope formula produces the equation [latex]m=\frac{2-6}{0-\left(-2\right)}=\frac{-4}{2}=-2[/latex]. Once again, the slope is [latex]m=-2[/latex]. That’s the same slope as before. The important thing is to be consistent when you subtract: you must always subtract in the same order [latex]\left(y_{2},y_{1}\right)[/latex] and [latex]\left(x_{2},x_{1}\right)[/latex].
Example
What is the slope of the line that contains the points [latex](5,5)[/latex] and [latex](4,2)[/latex]?
The example below shows the solution when you reverse the order of the points, calling [latex](5,5)[/latex] Point 1 and [latex](4,2)[/latex] Point 2.
Example
What is the slope of the line that contains the points [latex](5,5)[/latex] and [latex](4,2)[/latex]?
Notice that regardless of which ordered pair is named Point 1 and which is named Point 2, the slope is still 3.
Example (Advanced)
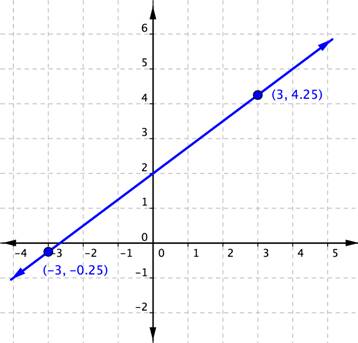
What is the slope of the line that contains the points [latex](3,-6.25)[/latex] and [latex](-1,8.5)[/latex]?
Let’s consider a horizontal line on a graph. No matter which two points you choose on the line, they will always have the same y-coordinate. The equation for this line is [latex]y=3[/latex]. The equation can also be written as [latex]y=\left(0\right)x+3[/latex].
Finding the Slopes of Horizontal and Vertical Lines
So far you’ve considered lines that run “uphill” or “downhill.” Their slopes may be steep or gradual, but they are always positive or negative numbers. But there are two other kinds of lines, horizontal and vertical. What is the slope of a flat line or level ground? Of a wall or a vertical line?
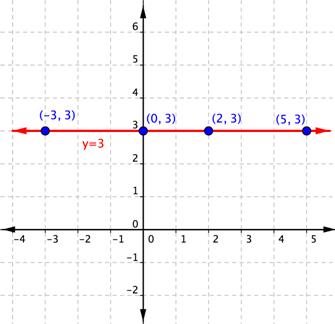
Using the form [latex]y=0x+3[/latex], you can see that the slope is 0. You can also use the slope formula with two points on this horizontal line to calculate the slope of this horizontal line. Using [latex](−3,3)[/latex] as Point 1 and (2, 3) as Point 2, you get:
[latex]\displaystyle \begin{array}{l}m=\frac{{{y}_{2}}-{{y}_{1}}}{{{x}_{2}}-{{x}_{1}}}\\\\m=\frac{3-3}{2-\left(-3\right)}=\frac{0}{5}=0\end{array}[/latex]
The slope of this horizontal line is 0.
Let’s consider any horizontal line. No matter which two points you choose on the line, they will always have the same y-coordinate. So, when you apply the slope formula, the numerator will always be 0. Zero divided by any non-zero number is 0, so the slope of any horizontal line is always 0.
The equation for the horizontal line [latex]y=3[/latex] is telling you that no matter which two points you choose on this line, the y-coordinate will always be 3.
How about vertical lines? In their case, no matter which two points you choose, they will always have the same x-coordinate. The equation for this line is [latex]x=2[/latex].
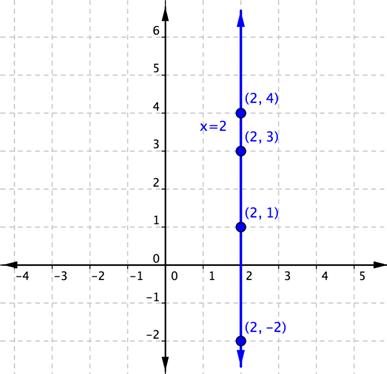
There is no way that this equation can be put in the slope-point form, as the coefficient of y is [latex]0\left(x=0y+2\right)[/latex].
So, what happens when you use the slope formula with two points on this vertical line to calculate the slope? Using [latex](2,1)[/latex] as Point 1 and [latex](2,3)[/latex] as Point 2, you get:
[latex]\displaystyle \begin{array}{l}m=\frac{{{y}_{2}}-{{y}_{1}}}{{{x}_{2}}-{{x}_{1}}}\\\\m=\frac{3-1}{2-2}=\frac{2}{0}\end{array}[/latex]
But division by zero has no meaning for the set of real numbers. Because of this fact, it is said that the slope of this vertical line is undefined. This is true for all vertical lines—they all have a slope that is undefined.
Example
What is the slope of the line that contains the points [latex](3,2)[/latex] and [latex](−8,2)[/latex]?
Characterize the slopes of parallel and perpendicular lines
When you graph two or more linear equations in a coordinate plane, they generally cross at a point. However, when two lines in a coordinate plane never cross, they are called parallel lines. You will also look at the case where two lines in a coordinate plane cross at a right angle. These are called perpendicular lines. The slopes of the graphs in each of these cases have a special relationship to each other.
Parallel lines are two or more lines in a plane that never intersect. Examples of parallel lines are all around us, such as the opposite sides of a rectangular picture frame and the shelves of a bookcase.
Perpendicular lines are two or more lines that intersect at a 90-degree angle, like the two lines drawn on this graph. These 90-degree angles are also known as right angles.
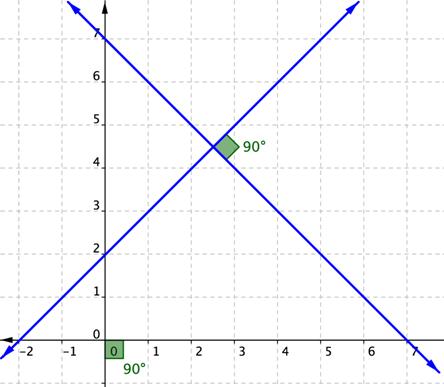
Perpendicular lines are also everywhere, not just on graph paper but also in the world around us, from the crossing pattern of roads at an intersection to the colored lines of a plaid shirt.
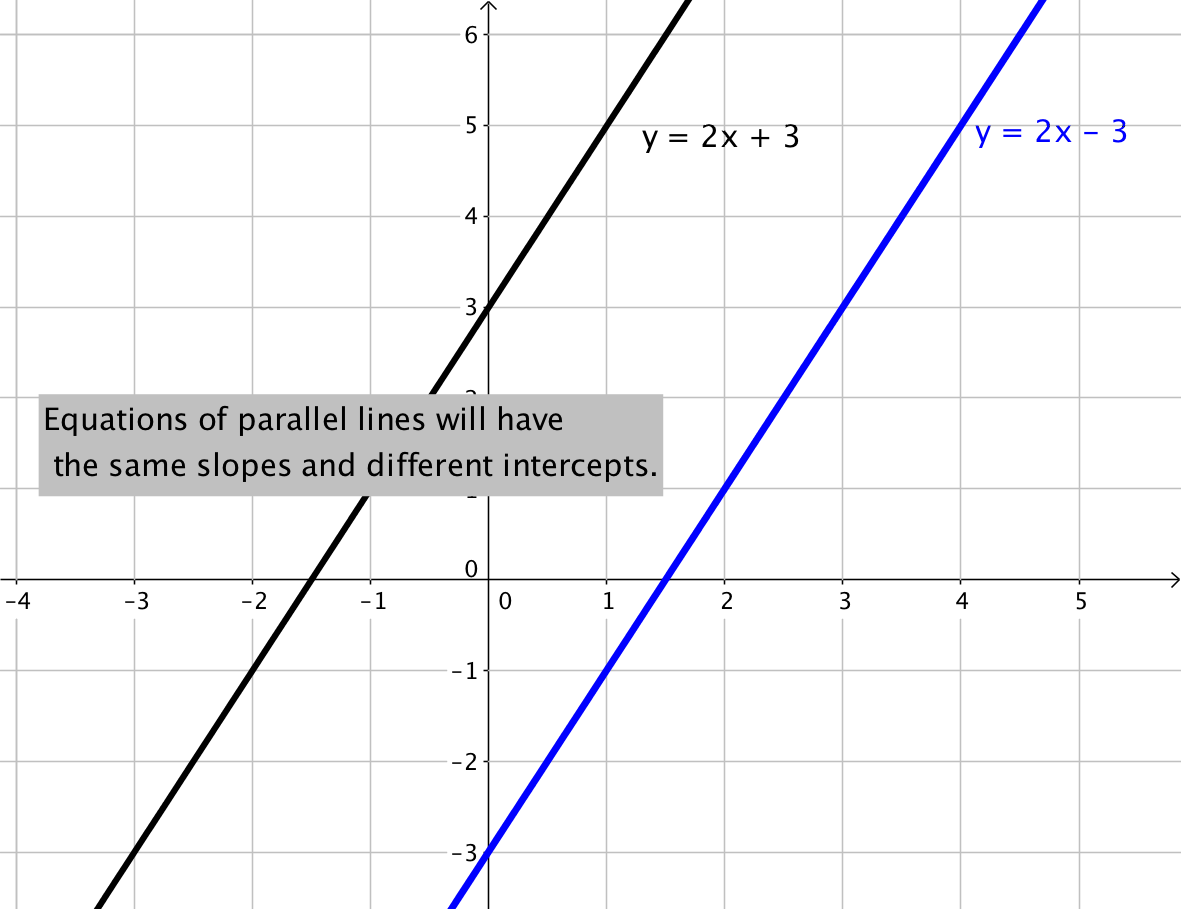
Parallel Lines
Two non-vertical lines in a plane are parallel if they have both:
- the same slope
- different y-intercepts
Any two vertical lines in a plane are parallel.
Example
Find the slope of a line parallel to the line [latex]y=−3x+4[/latex].
Example
Determine whether the lines [latex]y=6x+5[/latex] and [latex]y=6x–1[/latex] are parallel.
Perpendicular Lines
Two non-vertical lines are perpendicular if the slope of one is the negative reciprocal of the slope of the other. If the slope of the first equation is 4, then the slope of the second equation will need to be [latex]-\frac{1}{4}[/latex] for the lines to be perpendicular.
You can also check the two slopes to see if the lines are perpendicular by multiplying the two slopes together. If they are perpendicular, the product of the slopes will be [latex]−1[/latex]. For example, [latex]4\cdot-\frac{1}{4}=\frac{4}{1}\cdot-\frac{1}{4}=-1[/latex].
Example
Find the slope of a line perpendicular to the line [latex]y=2x–6[/latex].
To find the slope of a perpendicular line, find the reciprocal, [latex]\displaystyle \tfrac{1}{2}[/latex], and then find the opposite of this reciprocal [latex]\displaystyle -\tfrac{1}{2}[/latex].
Note that the product [latex]2\left(-\frac{1}{2}\right)=\frac{2}{1}\left(-\frac{1}{2}\right)=-1[/latex], so this means the slopes are perpendicular.
In the case where one of the lines is vertical, the slope of that line is undefined and it is not possible to calculate the product with an undefined number. When one line is vertical, the line perpendicular to it will be horizontal, having a slope of zero ([latex]m=0[/latex]).
Example
Determine whether the lines [latex]y=−8x+5[/latex] and [latex]\displaystyle y\,\text{=}\,\,\frac{1}{8}x-1[/latex] are parallel, perpendicular, or neither.
Verify Slope From a Dataset
Massive amounts of data is being collected every day by a wide range of institutions and groups. This data is used for many purposes including business decisions about location and marketing, government decisions about allocation of resources and infrastructure, and personal decisions about where to live or where to buy food.
In the following example, you will see how a dataset can be used to define the slope of a linear equation.
Example
Given the dataset, verify the values of the slopes of each equation.
Linear equations describing the change in median home values between 1950 and 2000 in Mississippi and Hawaii are as follows:
Hawaii: [latex]y=3966x+74,400[/latex]
Mississippi: [latex]y=924x+25,200[/latex]
The equations are based on the following dataset.
x = the number of years since 1950, and y = the median value of a house in the given state.
| Year (x) | Mississippi House Value (y) | Hawaii House Value (y) |
|---|---|---|
| 0 | $25,200 | $74,400 |
| 50 | $71,400 | $272,700 |
The slopes of each equation can be calculated with the formula you learned in the section on slope.
[latex]\displaystyle m=\frac{{{y}_{2}}-{{y}_{1}}}{{{x}_{2}}-{{x}_{1}}}[/latex]
Mississippi:
| Name | Ordered Pair | Coordinates |
|---|---|---|
| Point 1 | (0, 25,200) | [latex]\begin{array}{l}x_{1}=0\\y_{1}=25,200\end{array}[/latex] |
| Point 2 | (50, 71,400) | [latex]\begin{array}{l}x_{2}=50\\y_{2}=71,400\end{array}[/latex] |
[latex]\displaystyle m=\frac{{71,400}-{25,200}}{{50}-{0}}=\frac{{46,200}}{{50}} = 924[/latex]
We have verified that the slope [latex]\displaystyle m = 924[/latex] matches the dataset provided.
Hawaii:
| Name | Ordered Pair | Coordinates |
|---|---|---|
| Point 1 | (0, 74,400) | [latex]\begin{array}{l}x_{1}=1950\\y_{1}=74,400\end{array}[/latex] |
| Point 2 | (50, 272,700) | [latex]\begin{array}{l}x_{2}=2000\\y_{2}=272,700\end{array}[/latex] |
[latex]\displaystyle m=\frac{{272,700}-{74,400}}{{50}-{0}}=\frac{{198,300}}{{50}} = 3966[/latex]
We have verified that the slope [latex]\displaystyle m = 3966[/latex] matches the dataset provided.
Example
Given the dataset, verify the values of the slopes of the equation.
A linear equation describing the change in the number of high school students who smoke, in a group of 100, between 2011 and 2015 is given as:
[latex]y = -1.75x+16[/latex]
And is based on the data from this table, provided by the Centers for Disease Control.
x = the number of years since 2011, and y = the number of high school smokers per 100 students.
| Year | Number of High School Students Smoking Cigarettes (per 100) |
| 0 | 16 |
| 4 | 9 |
| Name | Ordered Pair | Coordinates |
|---|---|---|
| Point 1 | (0, 16) | [latex]\begin{array}{l}x_{1}=0\\y_{1}=16\end{array}[/latex] |
| Point 2 | (4, 9) | [latex]\begin{array}{l}x_{2}=4\\y_{2}=9\end{array}[/latex] |
[latex]\displaystyle m=\frac{{{y}_{2}}-{{y}_{1}}}{{{x}_{2}}-{{x}_{1}}}=\frac{{9-16}}{{4-0}} =\frac{{-7}}{{4}}=-1.75[/latex]
We have verified that the slope [latex]\displaystyle{m=-1.75}[/latex] matches the dataset provided.
Interpret the Slope of Linear Equation
Okay, now we have verified that data can provide us with the slope of a linear equation. So what? We can use this information to describe how something changes using words.
First, let’s review the different kinds of slopes possible in a linear equation.
We often use specific words to describe the different types of slopes when we are using lines and equations to represent “real” situations. The following table pairs the type of slope with the common language used to describe it both verbally and visually.
| Type of Slope | Visual Description | Verbal Description |
| positive | uphill | increasing |
| negative | downhill | decreasing |
| 0 | horizontal | constant |
| undefined | vertical | N/A |
Example
Interpret the slope of each equation for house values using words.
Hawaii: [latex]y = 3966x+74,400[/latex]
Mississippi: [latex]y = 924x+25,200[/latex]
Example
Interpret the slope of the line describing the change in the number of high school smokers using words.
Apply units to the formula for slope. The x values represent years, and the y values represent the number of smokers. Remember that this dataset is per 100 high school students.
[latex]\displaystyle m=\frac{{9-16}}{{2015-2011}} =\frac{{-7 \text{ smokers}}}{{4\text{ year}}}=-1.75\frac{\text{ smokers}}{\text{ year}}[/latex]
The slope of this linear equation is negative, so this tells us that there is a decrease in the number of high school age smokers each year.
The number of high schoolers that smoke decreases by 1.75 per 100 each year.
Equations of Lines
When graphing a line one method we could use is to make a table of values. However, if we can identify some properties of the line, we may be able to make a graph much quicker and easier. One such method is finding the slope and the y-intercept of the equation. The slope can be represented by m and the y-intercept, where it crosses the axis and [latex]x=0[/latex], can be represented by [latex](0,b)[/latex] where b is the value where the graph crosses the vertical y-axis. Any other point on the line can be represented by [latex](x,y)[/latex].
In the equation,
[latex]y = mx + b[/latex]
[latex]\begin{array}{l}\,\,\,\,\,m\,\,\,\,=\,\,\,\text{slope}\\(x,y)=\,\,\,\text{a point on the line}\\\,\,\,\,\,\,\,b\,\,\,\,=\,\,\,\text{the y value of the y-intercept}\end{array}[/latex]
This formula is known as the slope-intercept equation. If we know the slope and the y-intercept we can easily find the equation that represents the line
Example
Write the equation of the line that has a slope of [latex]\displaystyle \frac{1}{2}[/latex] and a y-intercept of [latex]−5[/latex].
We can also find the equation by looking at a graph and finding the slope and y-intercept.
Example
Write the equation of the line in the graph by identifying the slope and y-intercept.
We can also move the opposite direction, using the equation identify the slope and y-intercept and graph the equation from this information. However, it will be important for the equation to first be in slope intercept form. If it is not, we will have to solve it for y so we can identify the slope and the y-intercept.
Example
Write the following equation in slope-intercept form.
[latex]2x+4y=6[/latex]
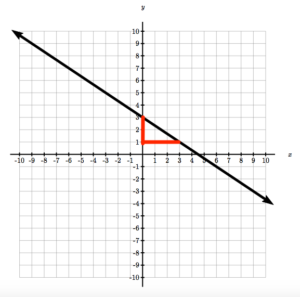
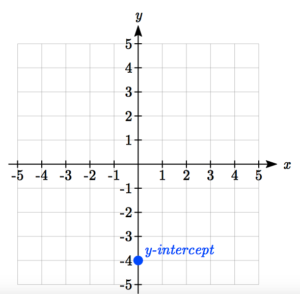
Once we have an equation in slope-intercept form we can graph it by first plotting the y-intercept, then using the slope, find a second point and connecting the dots.
Example
Graph [latex]y=\frac{1}{2}x-4[/latex] using the slope-intercept equation.

Find the Equation of a Line Given the Slope and a Point on the Line
Using the slope-intercept equation of a line is possible when you know both the slope (m) and the y-intercept (b), but what if you know the slope and just any point on the line, not specifically the y-intercept? Can you still write the equation? The answer is yes, but you will need to put in a little more thought and work than you did previously.
Recall that a point is an (x, y) coordinate pair and that all points on the line will satisfy the linear equation. So, if you have a point on the line, it must be a solution to the equation. Although you don’t know the exact equation yet, you know that you can express the line in slope-intercept form, [latex]y=mx+b[/latex].
You do know the slope (m), but you just don’t know the value of the y-intercept (b). Since point (x, y) is a solution to the equation, you can substitute its coordinates for x and y in [latex]y=mx+b[/latex] and solve to find b!
This may seem a bit confusing with all the variables, but an example with an actual slope and a point will help to clarify.
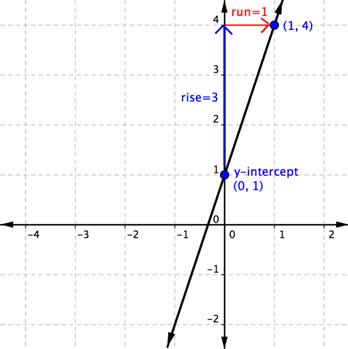
Example
Write the equation of the line that has a slope of 3 and contains the point [latex](1,4)[/latex].
To confirm our algebra, you can check by graphing the equation [latex]y=3x+1[/latex]. The equation checks because when graphed it passes through the point [latex](1,4)[/latex].
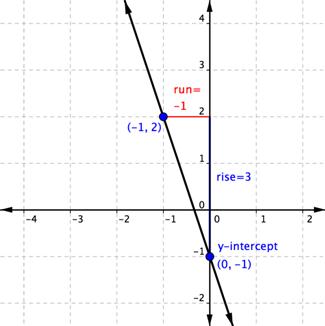
If you know the slope of a line and a point on the line, you can draw a graph. Using an equation in the point-slope form allows you to identify the slope and a point. Consider the equation [latex]\displaystyle y=-3x-1[/latex]. The y-intercept is the point on the line where it passes through the y-axis. What is the value of x at this point?
Therefore, you can tell from this equation that the y-intercept is at [latex](0,−1)[/latex], check this by replacing x with 0 and solving for y. To graph the line, start by plotting that point, [latex](0,−1)[/latex], on a graph.
You can also tell from the equation that the slope of this line is [latex]−3[/latex]. So start at [latex](0,−1)[/latex] and count up 3 and over [latex]−1[/latex] (1 unit in the negative direction, left) and plot a second point. (You could also have gone down 3 and over 1.) Then draw a line through both points, and there it is, the graph of [latex]\displaystyle y=-3x-1[/latex].
Example (Advanced)
Write the equation of the line that has a slope of [latex]-\frac{7}{8}[/latex] and contains the point [latex]\left(4,\frac{5}{4}\right)[/latex].
Find the Equation of a Line Given Two Points on the Line
Let’s suppose you don’t know either the slope or the y-intercept, but you do know the location of two points on the line. It is more challenging, but you can find the equation of the line that would pass through those two points. You will again use slope-intercept form to help you.
The slope of a linear equation is always the same, no matter which two points you use to find the slope. Since you have two points, you can use those points to find the slope (m). Now you have the slope and a point on the line! You can now substitute values for m, x, and y into the equation [latex]y=mx+b[/latex] and find b.
Example
Write the equation of the line that passes through the points [latex](2,1)[/latex] and [latex](−1,−5)[/latex].
Notice that is doesn’t matter which point you use when you substitute and solve for b—you get the same result for b either way. In the example above, you substituted the coordinates of the point (2, 1) in the equation [latex]y=2x+b[/latex]. Let’s start with the same equation, [latex]y=2x+b[/latex], but substitute in [latex](−1,−5)[/latex]:
[latex]\begin{array}{l}\,\,\,\,\,y=2x+b\\-5=2\left(-1\right)+b\\-5=-2+b\\-3=b\end{array}[/latex]
The final equation is the same: [latex]y=2x–3[/latex].
Example (Advanced)
Write the equation of the line that passes through the points [latex](-4.6,6.45)[/latex] and [latex](1.15,7.6)[/latex].
Write the equations of parallel and perpendicular lines
The relationships between slopes of parallel and perpendicular lines can be used to write equations of parallel and perpendicular lines.
Let’s start with an example involving parallel lines.
Example
Write the equation of a line that is parallel to the line [latex]x–y=5[/latex] and goes through the point [latex](−2,1)[/latex].
Determine the Equation of a Line Perpendicular to Another Line Through a Given Point
When you are working with perpendicular lines, you will usually be given one of the lines and an additional point. Remember that two non-vertical lines are perpendicular if the slope of one is the negative reciprocal of the slope of the other. To find the slope of a perpendicular line, find the reciprocal, and then find the opposite of this reciprocal. In other words, flip it and change the sign.
Example
Write the equation of a line that contains the point [latex](1,5)[/latex] and is perpendicular to the line [latex]y=2x– 6[/latex].
Example
Write the equation of a line that is parallel to the line [latex]y=4[/latex] through the point [latex](0,10)[/latex].
Example
Write the equation of a line that is perpendicular to the line [latex]y=-3[/latex] through the point [latex](-2,5)[/latex].
Interpret the y-intercept of a linear equation
Often, when the line in question represents a set of data or observations, the y-intercept can be interpreted as a starting point. We will continue to use the examples for house value in Mississippi and Hawaii and high school smokers to interpret the meaning of the y-intercept in those equations.
Example
Recall the equations and data for house value:
Linear equations describing the change in median home values between 1950 and 2000 in Mississippi and Hawaii are as follows:
Hawaii: [latex]y = 3966x+74,400[/latex]
Mississippi: [latex]y = 924x+25,200[/latex]
The equations are based on the following dataset.
x = the number of years since 1950, and y = the median value of a house in the given state.
| Year (x) | Mississippi House Value (y) | Hawaii House Value (y) |
|---|---|---|
| 0 | $25,200 | $74,400 |
| 50 | $71,400 | $272,700 |
And the equations and data for high school smokers:
A linear equation describing the change in the number of high school students who smoke, in a group of 100, between 2011 and 2015 is given as:
[latex]y = -1.75x+16[/latex]
And is based on the data from this table, provided by the Centers for Disease Control.
x = the number of years since 2011, and y = the number of high school smokers per 100 students.
| Year | Number of High School Students Smoking Cigarettes (per 100) |
| 0 | 16 |
| 4 | 9 |
Also recall that the equation of a line in slope-intercept form is as follows:
[latex]y = mx + b[/latex]
[latex]\begin{array}{l}\,\,\,\,\,m\,\,\,\,=\,\,\,\text{slope}\\(x,y)=\,\,\,\text{a point on the line}\\\,\,\,\,\,\,\,b\,\,\,\,=\,\,\,\text{the y value of the y-intercept}\end{array}[/latex]
The examples that follow show how to interpret the y-intercept of the equations used to model house value and the number of high school smokers. Additionally, you will see how to use the equations to make predictions about house value and the number of smokers in future years.
Example
Interpret the y-intercepts of the equations that represent the change in house value for Hawaii and Mississippi.
Hawaii: [latex]y = 3966x+74,400[/latex]
Mississippi: [latex]y = 924x+25,200[/latex]
The y-intercept of a two-variable linear equation can be found by substituting 0 in for x.
Hawaii
[latex]y = 3966x+74,400\\y = 3966(0)+74,400\\y = 74,400[/latex]
The y-intercept is a point, so we write it as (0, 74,400). Remember that y-values represent dollars and x values represent years. When the year is 0—in this case 0 because that is the first date we have in the dataset—the price of a house in Hawaii was $74,400.
Mississippi
[latex]y = 924x+25,200\\y = 924(0)+25,200\\y = 25,200[/latex]
The y-intercept is (0, 25,200). This means that in 1950 the value of a house in Mississippi was $25,200. Remember that x represents the number of years since 1950, so if [latex]x=0[/latex] the year is 1950.
Example
Interpret the y-intercept of the equation that represents the change in the number of high school students who smoke out of 100.
Substitute 0 in for x.
[latex]y = -1.75x+16\\y = -1.75(0)+16\\y = 16[/latex]
The y-intercept is [latex](0,16)[/latex]. The data starts at 2011, so we represent that year as 0. We can interpret the y-intercept as follows:
In the year 2011, 16 out of every 100 high school students smoked.
Use a linear equation to make a prediction
Another useful outcome we gain from writing equations from data is the ability to make predictions about what may happen in the future. We will continue our analysis of the house price and high school smokers. In the following examples you will be shown how to predict future outcomes based on the linear equations that model current behavior.
Example
Use the equations for house value in Hawaii and Mississippi to predict house value in 2035.
We are asked to find house value, y, when the year, x, is 2035. Since the equations we have represent house value increase since 1950, we have to be careful. We can’t just plug in 2035 for x, because x represents the years since 1950.
How many years are between 1950 and 2035? [latex]2035 - 1950 = 85[/latex]
This is our x-value.
For Hawaii:
[latex]y = 3966x+74,400\\y = 3966(85)+74,400\\y = 337110+74,400 = 411,510[/latex]
Holy cow! The average price for a house in Hawaii in 2035 is predicted to be $411,510 according to this model. See if you can find the current average value of a house in Hawaii. Does the model measure up?
For Mississippi:
[latex]y = 924x+25,200\\y = 924(85)+25,200\\y = 78540+25,200 = 103,740[/latex]
The average price for a home in Mississippi in 2035 is predicted to be $103,740 according to the model. See if you can find the current average value of a house in Mississippi. Does the model measure up?
Example
Use the equation for the number of high school smokers per 100 to predict the year when there will be 0 smokers per 100.
[latex]y = -1.75x+16[/latex]
This question takes a little more thinking. In terms of x and y, what does it mean to have 0 smokers? Since y represents the number of smokers and x represent the year, we are being asked when y will be 0.
Substitute 0 for y.
[latex]y = -1.75x+16[/latex]
[latex]0 = -1.75x+16[/latex]
[latex]-16 = -1.75x[/latex]
[latex]\frac{-16}{-1.75} = x[/latex]
[latex]x = 9.14[/latex] years
Again, like the last example, x is representing the number of years since the start of the data—which was 2011, based on the table:
| Year | Number of High School Students Smoking Cigarettes (per 100) |
| 0 | 16 |
| 4 | 9 |
So we are predicting that there will be no smokers in high school by [latex]2011+9.14=2020[/latex]. How accurate do you think this model is? Do you think there will ever be 0 smokers in high school?
Bringing it Together
The last example we will show will include many of the concepts that we have been building up throughout this section. We will interpret a word problem, write a linear equation from it, graph the equation, interpret the y-intercept and make a prediction. Hopefully this example will help you to make connections between the concepts we have presented.
Example
It costs $600 to purchase an iphone, plus $55 per month for unlimited use and data.
Write a linear equation that represents the cost, y, of owning and using the iPhone for x amount of months. When you have written your equation, answer the following questions:
- What is the total cost you’ve paid after owning and using your phone for 24 months?
- If you have spent $2,580 since you purchased your phone, how many months have you used your phone?

iPhone
Read and Understand: We need to write a linear equation that represents the cost of owning and using an iPhone for any number of months. We are to use y to represent cost, and x to represent the number of months we have used the phone.
Define and Translate: We will use the slope-intercept form of a line, [latex]y=mx+b[/latex], because we are given a starting cost and a monthly cost for use. We will need to find the slope and the y-intercept.
Slope: in this case we don’t know two points, but we are given a rate in dollars for monthly use of the phone. Our units are dollars per month because slope is [latex]\frac{\Delta{y}}{\Delta{x}}[/latex], and y is in dollars and x is in months. The slope will be [latex]\frac{55\text{ dollars }}{1\text{ month }}[/latex]. [latex]m=\frac{55}{1}=55[/latex]
Y-Intercept: the y-intercept is defined as a point [latex]\left(0,b\right)[/latex]. We want to know how much money we have spent, y, after 0 months. We haven’t paid for service yet, but we have paid $600 for the phone. The y-intercept in this case is called an initial cost. [latex]b=600[/latex]
Write and Solve: Substitute the slope and intercept you defined into the slope=intercept equation.
[latex]\begin{array}{c}y=mx+b\\y=55x+600\end{array}[/latex]
Now we will answer the following questions:
- What is the total cost you’ve paid after owning and using your phone for 24 months?
Since x represents the number of months you have used the phone, we can substitute x=24 into our equation.
[latex]\begin{array}{c}y=55x+600\\y=55\left(24\right)+600\\y=1320+600\\y=1920\end{array}[/latex]
Y represents the cost after x number of months, so in this scenario, after 24 months, you have spent $1920 to own and use an iPhone.
- If you have spent $2,580 since you purchased your phone, how many months have you used your phone?
We know that y represents cost, and we are given a cost and asked to find the number of months related to having spent that much. We will substitute y=$2,580 into the equation, then use what we know about solving linear equations to isolate x:
[latex]\begin{array}{l}\,\,\,\,\,\,\,\,\,\,\,\,\,\,\,\,\,\,\,\,\,\,\,\,\,\,\,\,\,\,\,\,\,\,\,\,\,\,\,\,\,\,\,\,\,\,\,\,\,\,\,\,\,\,\,\,\,\,\,\,\,\,\,\,\,\,\,\,\,\,\,\,\,\,\,\,\,\,\,\,\,\,y=55x+600\\\,\,\,\,\,\,\,\,\,\,\,\,\,\,\,\,\,\,\,\,\,\,\,\,\,\,\,\,\,\,\,\,\,\,\,\,\,\,\,\,\,\,\,\,\,\,\,\,\,\,\,\,\,\,\,\,\,\,\,\,\,\,\,\,\,\,\,\,\,\,\,\,\,2580=55x+600\\\text{ subtract 600 from each side}\,\,\,\,\,\,\,\underline{-600}\,\,\,\,\,\,\,\,\,\,\,\,\,\,\,\,\underline{-600}\\\text{}\\\,\,\,\,\,\,\,\,\,\,\,\,\,\,\,\,\,\,\,\,\,\,\,\,\,\,\,\,\,\,\,\,\,\,\,\,\,\,\,\,\,\,\,\,\,\,\,\,\,\,\,\,\,\,\,\,\,\,\,\,\,\,\,\,\,\,\,\,\,\,\,\,\,\,\,\,1980=55x\\\text{}\\\text{ divide each side by 55 }\,\,\,\,\,\,\,\,\,\,\,\,\,\,\,\,\,\,\,\,\frac{1980}{55}=\frac{55x}{55}\\\text{}\\\,\,\,\,\,\,\,\,\,\,\,\,\,\,\,\,\,\,\,\,\,\,\,\,\,\,\,\,\,\,\,\,\,\,\,\,\,\,\,\,\,\,\,\,\,\,\,\,\,\,\,\,\,\,\,\,\,\,\,\,\,\,\,\,\,\,\,\,\,\,\,\,\,\,\,\,36=x\end{array}[/latex]
If you have spent $2,580 then you have been using your iPhone for 36 months, or 3 years.