Recall that cardiac muscle shares a few characteristics with both skeletal muscle and smooth muscle, but it has some unique properties of its own. Not the least of these exceptional properties is its ability to initiate an electrical potential at a fixed rate that spreads rapidly from cell to cell to trigger the contractile mechanism. This property is known as autorhythmicity. Neither smooth nor skeletal muscle can do this. Even though cardiac muscle has autorhythmicity, heart rate is modulated by the endocrine and nervous systems.
There are two major types of cardiac muscle cells: myocardial contractile cells and myocardial conducting cells. The myocardial contractile cells constitute the bulk (99 percent) of the cells in the atria and ventricles. Contractile cells conduct impulses and are responsible for contractions that pump blood through the body. The myocardial conducting cells (1 percent of the cells) form the conduction system of the heart. They are generally much smaller than the contractile cells and have few of the myofibrils or filaments needed for contraction. Their function is similar in many respects to neurons, although they are specialized muscle cells. Myocardial conduction cells initiate and propagate the action potential (the electrical impulse) that travels throughout the heart and triggers the contractions that propel the blood.
Structure of Cardiac Muscle
Compared to the giant cylinders of skeletal muscle, cardiac muscle cells, or cardiomyocytes, are considerably shorter with much smaller diameters. Cardiac muscle also demonstrates striations, the alternating pattern of dark A bands and light I bands attributed to the precise arrangement of the myofilaments and fibrils that are organized in sarcomeres along the length of the cell. These contractile elements are virtually identical to skeletal muscle. Typically, cardiomyocytes have a single, central nucleus, but two or more nuclei may be found in some cells.
Cardiac muscle cells branch freely. A junction between two adjoining cells is marked by a critical structure called an intercalated disc, which helps support the synchronized contraction of the muscle. The sarcolemmas from adjacent cells bind together at the intercalated discs. They consist of desmosomes, specialized linking proteoglycans, tight junctions, and large numbers of gap junctions that allow the passage of ions between the cells and help to synchronize the contraction.
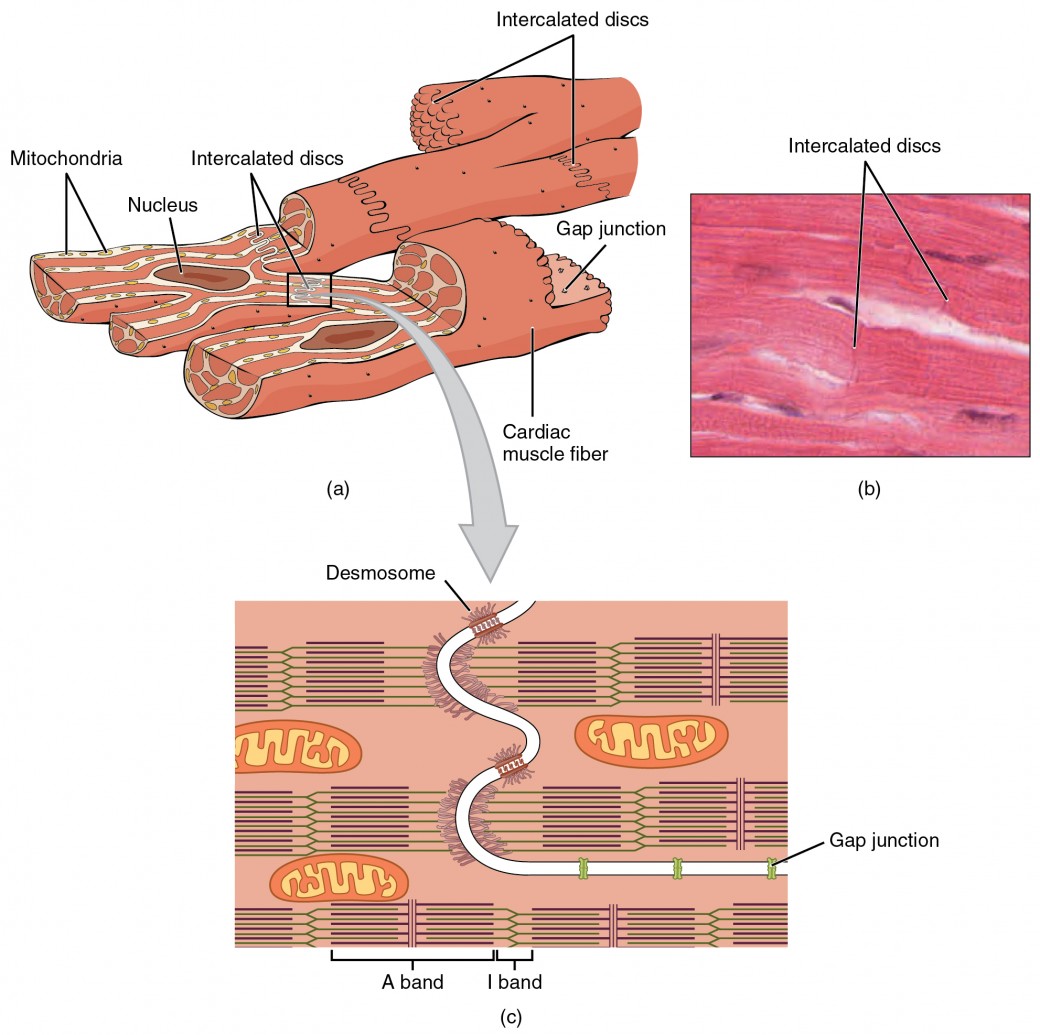
Figure 1. (a) Cardiac muscle cells have myofibrils composed of myofilaments arranged in sarcomeres, T tubules to transmit the impulse from the sarcolemma to the interior of the cell, numerous mitochondria for energy, and intercalated discs that are found at the junction of different cardiac muscle cells. (b) A photomicrograph of cardiac muscle cells shows the nuclei and intercalated discs. (c) An intercalated disc connects cardiac muscle cells and consists of desmosomes and gap junctions. LM × 1600. (Micrograph provided by the Regents of the University of Michigan Medical School © 2012)
Everyday Connection: Repair and Replacement
Damaged cardiac muscle cells have extremely limited abilities to repair themselves or to replace dead cells via mitosis. Recent evidence indicates that at least some stem cells remain within the heart that continue to divide and at least potentially replace these dead cells. However, newly formed or repaired cells are rarely as functional as the original cells, and cardiac function is reduced. In the event of a heart attack or MI, dead cells are often replaced by patches of scar tissue. Autopsies performed on individuals who had successfully received heart transplants show some proliferation of original cells. If researchers can unlock the mechanism that generates new cells and restore full mitotic capabilities to heart muscle, the prognosis for heart attack survivors will be greatly enhanced. To date, myocardial cells produced within the patient (in situ) by cardiac stem cells seem to be nonfunctional, although those grown in Petri dishes (in vitro) do beat. Perhaps soon this mystery will be solved, and new advances in treatment will be commonplace.
Conduction System of the Heart
If embryonic heart cells are separated into a Petri dish and kept alive, each is capable of generating its own electrical impulse followed by contraction. When two independently beating embryonic cardiac muscle cells are placed together, the cell with the higher inherent rate sets the pace, and the impulse spreads from the faster to the slower cell to trigger a contraction. As more cells are joined together, the fastest cell continues to assume control of the rate. A fully developed adult heart maintains the capability of generating its own electrical impulse, triggered by the fastest cells, as part of the cardiac conduction system. The components of the cardiac conduction system include the sinoatrial node, the atrioventricular node, the atrioventricular bundle, the atrioventricular bundle branches, and the Purkinje cells.

Figure 2. Specialized conducting components of the heart include the sinoatrial node, the internodal pathways, the atrioventricular node, the atrioventricular bundle, the right and left bundle branches, and the Purkinje fibers.
Sinoatrial (SA) Node
Normal cardiac rhythm is established by the sinoatrial (SA) node, a specialized clump of myocardial conducting cells located in the superior and posterior walls of the right atrium in close proximity to the superior vena cava. The SA node has the highest rate of depolarization and is known as the pacemaker of the heart. It initiates the sinus rhythm, or normal electrical pattern followed by contraction of the heart.
This impulse spreads from its initiation in the SA node throughout the atria through specialized internodal pathways, to the atrial myocardial contractile cells and the atrioventricular node. The impulse takes approximately 50 ms (milliseconds) to travel between these two nodes. Figure 3 illustrates the initiation of the impulse in the SA node that then spreads the impulse throughout the atria to the atrioventricular node. The electrical event, the wave of depolarization, is the trigger for muscular contraction. The wave of depolarization begins in the right atrium, and the impulse spreads across the superior portions of both atria and then down through the contractile cells. The contractile cells then begin contraction from the superior to the inferior portions of the atria, efficiently pumping blood into the ventricles.

Figure 3. (1) The sinoatrial (SA) node and the remainder of the conduction system are at rest. (2) The SA node initiates the action potential, which sweeps across the atria. (3) After reaching the atrioventricular node, there is a delay of approximately 100 ms that allows the atria to complete pumping blood before the impulse is transmitted to the atrioventricular bundle. (4) Following the delay, the impulse travels through the atrioventricular bundle and bundle branches to the Purkinje fibers, and also reaches the right papillary muscle via the moderator band. (5) The impulse spreads to the contractile fibers of the ventricle. (6) Ventricular contraction begins.
Atrioventricular (AV) Node
The atrioventricular (AV) node is a second clump of specialized myocardial conductive cells, located in the inferior portion of the right atrium within the atrioventricular septum. The septum prevents the impulse from spreading directly to the ventricles without passing through the AV node. There is a critical pause before the AV node transmits the impulse to the atrioventricular bundle (see image above, step 3). This pause is critical to heart function, as it allows the atrial cardiomyocytes to complete their contraction that pumps blood into the ventricles before the impulse is transmitted to the cells of the ventricle itself. With extreme stimulation by the SA node, the AV node can transmit impulses maximally at 220 per minute. This establishes the typical maximum heart rate in a healthy young individual. Damaged hearts or those stimulated by drugs can contract at higher rates, but at these rates, the heart can no longer effectively pump blood.
Atrioventricular Bundle (Bundle of His), Bundle Branches, and Purkinje Fibers
Arising from the AV node, the atrioventricular bundle, or bundle of His, proceeds through the interventricular septum before dividing into two atrioventricular bundle branches, commonly called the left and right bundle branches. The left bundle branch supplies the left ventricle, and the right bundle branch the right ventricle. Since the left ventricle is much larger than the right, the left bundle branch is also considerably larger than the right. Both bundle branches descend and reach the apex of the heart where they connect with the Purkinje fibers (see image above, step 4). This passage takes approximately 25 ms.
The Purkinje fibers are additional myocardial conductive fibers that spread the impulse to the myocardial contractile cells in the ventricles. They extend throughout the myocardium from the apex of the heart toward the atrioventricular septum and the base of the heart. The Purkinje fibers have a fast inherent conduction rate, and the electrical impulse reaches all of the ventricular muscle cells in about 75 ms (see image above, step 5). Since the electrical stimulus begins at the apex, the contraction also begins at the apex and travels toward the base of the heart, similar to squeezing a tube of toothpaste from the bottom. This allows the blood to be pumped out of the ventricles and into the aorta and pulmonary trunk. The total time elapsed from the initiation of the impulse in the SA node until depolarization of the ventricles is approximately 225 ms.
Electrocardiogram
By careful placement of surface electrodes on the body, it is possible to record the complex, compound electrical signal of the heart. This tracing of the electrical signal is the electrocardiogram (ECG), also commonly abbreviated EKG (K coming kardiology, from the German term for cardiology). Careful analysis of the ECG reveals a detailed picture of both normal and abnormal heart function, and is an indispensable clinical diagnostic tool.
A normal ECG tracing is presented in Figure 4. Each component, segment, and interval is labeled and corresponds to important electrical events, demonstrating the relationship between these events and contraction in the heart.
There are five prominent points on the ECG: the P wave, the QRS complex, and the T wave. The small P wave represents the depolarization of the atria. The atria begin contracting approximately 25 ms after the start of the P wave. The large QRS complex represents the depolarization of the ventricles, which requires a much stronger electrical signal because of the larger size of the ventricular cardiac muscle. The ventricles begin to contract as the QRS reaches the peak of the R wave. Lastly, the T wave represents the repolarization of the ventricles. The repolarization of the atria occurs during the QRS complex, which masks it on an ECG.

Figure 4. A normal tracing shows the P wave, QRS complex, and T wave. Also indicated are the PR, QT, QRS, and ST intervals, plus the P-R and S-T segments.
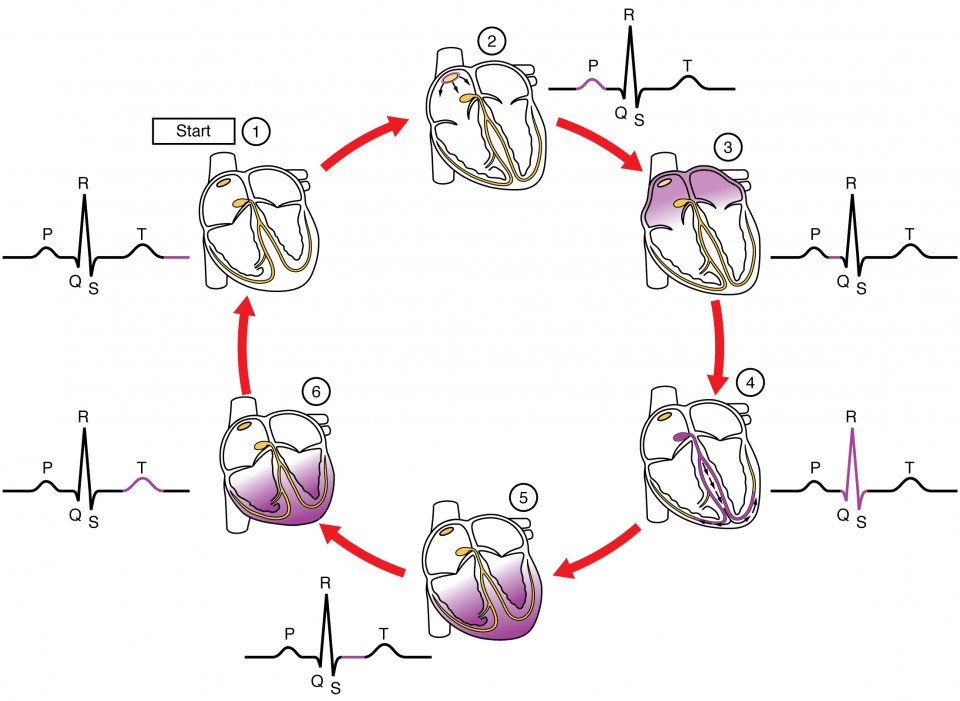
Figure 5. This diagram correlates an ECG tracing with the electrical and mechanical events of a heart contraction. Each segment of an ECG tracing corresponds to one event in the cardiac cycle.
Everyday Connection: External Automated Defibrillators
In the event that the electrical activity of the heart is severely disrupted, cessation of electrical activity or fibrillation may occur. In fibrillation, the heart beats in a wild, uncontrolled manner, which prevents it from being able to pump effectively. Atrial fibrillation is a serious condition, but as long as the ventricles continue to pump blood, the patient’s life may not be in immediate danger. Ventricular fibrillation is a medical emergency that requires life support, because the ventricles are not effectively pumping blood. In a hospital setting, it is often described as “code blue.” If untreated for as little as a few minutes, ventricular fibrillation may lead to brain death. The most common treatment is defibrillation, which uses special paddles to apply a charge to the heart from an external electrical source in an attempt to establish a normal sinus rhythm. A defibrillator effectively stops the heart so that the SA node can trigger a normal conduction cycle. Because of their effectiveness in reestablishing a normal sinus rhythm, external automated defibrillators (EADs) are being placed in areas frequented by large numbers of people, such as schools, restaurants, and airports. These devices contain simple and direct verbal instructions that can be followed by nonmedical personnel in an attempt to save a life.

Figure 10. (a) An external automatic defibrillator can be used by nonmedical personnel to reestablish a normal sinus rhythm in a person with fibrillation. (b) Defibrillator paddles are more commonly used in hospital settings. (credit b: “widerider107”/flickr.com)
Candela Citations
- Anatomy & Physiology. Provided by: OpenStax CNX. Located at: http://cnx.org/contents/14fb4ad7-39a1-4eee-ab6e-3ef2482e3e22@8.25. License: CC BY: Attribution. License Terms: Download for free at http://cnx.org/contents/14fb4ad7-39a1-4eee-ab6e-3ef2482e3e22@8.25