What you’ll learn to do: describe latent learning and observational learning
Classical and operant conditioning are responsible for a good bit of the behaviors we learn and develop, but certainly there are other things we learn simply through observation and thought. Latent learning is a form of learning that occurs without any obvious reinforcement of the behavior or associations that are learned.
According to Albert Bandura, learning can occur by watching others and then modeling what they do or say. This is known as observational learning. There are specific steps in the process of modeling that must be followed if learning is to be successful. These steps include attention, retention, reproduction, and motivation. Through modeling, Bandura has shown that children learn many things both good and bad simply by watching their parents, siblings, and others. What have you learned by observation?
Learning Objectives
- Explain latent learning and cognitive maps
- Describe Edward Tolman’s experiment on latent learning
Although strict behaviorists such as Skinner and Watson refused to believe that cognition (such as thoughts and expectations) plays a role in learning, another behaviorist, Edward C. Tolman, had a different opinion. Tolman’s experiments with rats demonstrated that organisms can learn even if they do not receive immediate reinforcement (Tolman & Honzik, 1930; Tolman, Ritchie, & Kalish, 1946).
Latent learning is a form of learning that is not immediately expressed in an overt response. It occurs without any obvious reinforcement of the behavior or associations that are learned. Latent learning is not readily apparent to the researcher because it is not shown behaviorally until there is sufficient motivation. This type of learning broke the constraints of behaviorism, which stated that processes must be directly observable and that learning was the direct consequence of conditioning to stimuli.
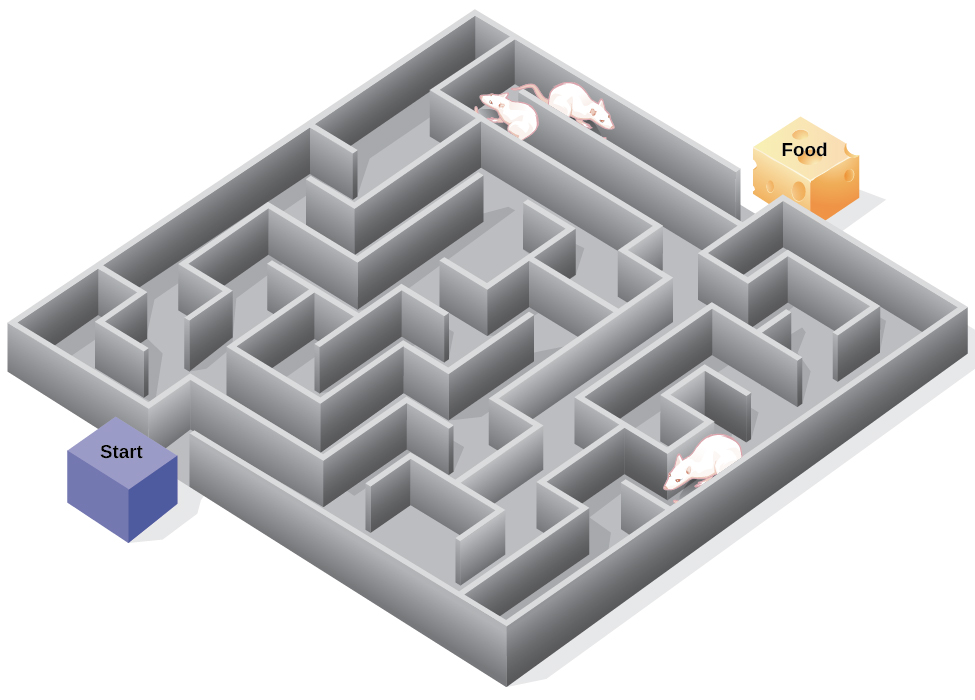
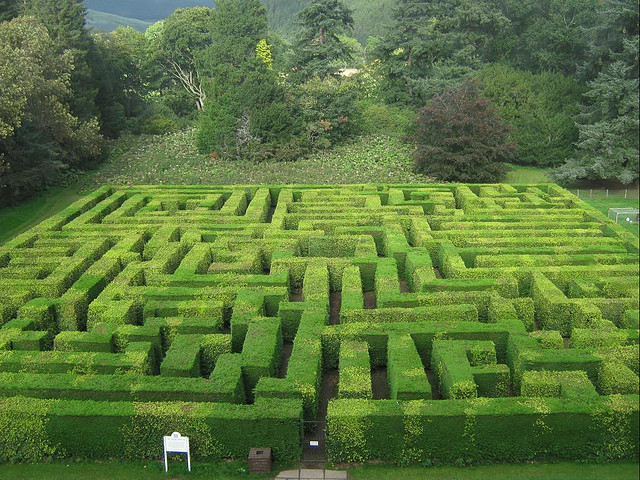
Figure 1. Psychologist Edward Tolman found that rats use cognitive maps to navigate through a maze. Have you ever worked your way through various levels on a video game? You learned when to turn left or right, move up or down. In that case you were relying on a cognitive map, just like the rats in a maze. (credit: modification of work by “FutUndBeidl”/Flickr)
Latent learning also occurs in humans. Children may learn by watching the actions of their parents but only demonstrate it at a later date, when the learned material is needed. For example, suppose that Ravi’s dad drives him to school every day. In this way, Ravi learns the route from his house to his school, but he’s never driven there himself, so he has not had a chance to demonstrate that he’s learned the way. One morning Ravi’s dad has to leave early for a meeting, so he can’t drive Ravi to school. Instead, Ravi follows the same route on his bike that his dad would have taken in the car. This demonstrates latent learning. Ravi had learned the route to school, but had no need to demonstrate this knowledge earlier.
Everyday Connection: This Place Is Like a Maze
Have you ever gotten lost in a building and couldn’t find your way back out? While that can be frustrating, you’re not alone. At one time or another we’ve all gotten lost in places like a museum, hospital, or university library. Whenever we go someplace new, we build a mental representation—or cognitive map—of the location, as Tolman’s rats built a cognitive map of their maze. However, some buildings are confusing because they include many areas that look alike or have short lines of sight. Because of this, it’s often difficult to predict what’s around a corner or decide whether to turn left or right to get out of a building. Psychologist Laura Carlson (2010) suggests that what we place in our cognitive map can impact our success in navigating through the environment. She suggests that paying attention to specific features upon entering a building, such as a picture on the wall, a fountain, a statue, or an escalator, adds information to our cognitive map that can be used later to help find our way out of the building.
Link to Learning
Watch this video to learn more about Carlson’s studies on cognitive maps and navigation in buildings.
Try It
Tolman’s Experiment
Edward Tolman was studying traditional trial-and-error learning when he realized that some of his research subjects (rats) actually knew more than their behavior initially indicated. In one of Tolman’s classic experiments, he observed the behavior of three groups of hungry rats that were learning to navigate mazes.
The first group always received a food reward at the end of the maze, so the payoff for learning the maze was real and immediate. The second group never received any food reward, so there was no incentive to learn to navigate the maze effectively. The third group was like the second group for the first 10 days, but on the 11th day, food was now placed at the end of the maze.
As you might expect when considering the principles of conditioning, the rats in the first group quickly learned to negotiate the maze, while the rats of the second group seemed to wander aimlessly through it. The rats in the third group, however, although they wandered aimlessly for the first 10 days, quickly learned to navigate to the end of the maze as soon as they received food on day 11. By the next day, the rats in the third group had caught up in their learning to the rats that had been rewarded from the beginning. It was clear to Tolman that the rats that had been allowed to experience the maze, even without any reinforcement, had nevertheless learned something, and Tolman called this latent learning. Latent learning is to learning that is not reinforced and not demonstrated until there is motivation to do so. Tolman argued that the rats had formed a “cognitive map” of the maze but did not demonstrate this knowledge until they received reinforcement.

Figure 1. The maze. As you can see from the map, the maze had lots of doors and curtains to make it difficult for the rats to master. The blue marks represent doors that swung both directions, which prevented the rat from seeing most of the junctions as it approached. This forced the rat to go through the door to discover what was on the other side. The green forms show curtains. These hung down and prevented the rat from getting a long distance perspective and it also meant that they could not see a wall at the end of a wrong turn until they had already made a choice and moved in that direction. The rat was always in a small area, unable to see beyond the next door or curtain, so learning the maze was a formidable task.
Try It
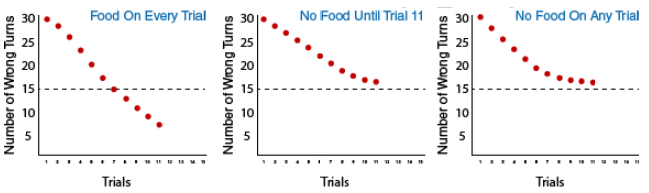
Now that you’ve learned the design of the study, let’s take a closer look at what happened in the study. The results for the three groups will be shown in these graphs. The graph on the left is for the group that always received food. The middle graph is for the rats that did not received food for the first 10 trials and then, on Trial #11, started to receive food. The graph on the right is for rats that never received food. The red dots indicate how the rats did in each of the three conditions. The Y-axis (vertical axis) indicates how many wrong turns, or errors, the rats in each condition made on average. The X-axis (horizontal axis) shows the different trials. This is the first trial, so none of the rats knew there was food in the food box.

Try It
Let’s see how the rats in each group did over the next four trials. Notice all the groups made fewer errors and continue to do so in Trial 4. Now look more closely at trials 4 and 5. Are you starting to see a difference between the groups? Use the dotted line in the middle of the graphs as a reference point for comparing the groups. Which group seems to be getting to the line faster?

Try It
Let’s pick up at Trial 7. Notice that the group on the left, which receives food on every trial, continues to improve at a faster rate than the other two groups. These two groups are both performing at the same level and are making about 20 wrong turns on each trial on average. At Trial 10, we are at a critical point in the experiment because things are about to change on the next trial for the rats shown in the middle graph. Something special will happen to this group. Food will now appear in the food box! Of course, they won’t know this until they get there, so the effects of the change should not appear on the next trial. As you can see from the graphs for Trial 11, the groups shown in the middle and right graphs still look the same. The rats in the left group are now making fewer wrong turns than either of the other two groups.
Work It out
Your task here is to predict what is going to happen on Trial 12 for the “no food until Trial 11” group.
Option A: Notice that this result is the same as the “no food on any trial” group. So, if you choose option A, you think that they will not act differently now than they acted on the first 11 trials and they will continue to make a lot of wrong turns.
Option B: This option suggests that they are now motivated to learn the path to the food, but that they will do so in small steps, just as we have seen for all three groups up to this point. Option B says that they are moving in the direction of the “food on every trial” group, but that it will take some extra learning to get there.
Option C: This option says that they already know the path to the food and, now that they are motivated to get there, they will show that they already know just as much as the “food on every trial” group. Their performance on Trial 12 will be the same as the low-error performance of the “food on every trial” group.

So, what happened to the rats in the group that began to receive food at Trial 11? They were immediately able to make their way through the maze without making many wrong turns to get to the food. They made about the same number of errors as the “Food on Every Trial” group! Tolman interpreted this to mean that they had created a mental map of the maze during the first 11 trials…and when they needed to get food, they could find their way to the food box very efficiently!

As we look at trials 13, 14, and 15, notice how the graph for the group of rats on the left –- the ones that received food on every trial — and the graph for the group of rats in the middle — the ones that started receiving food at trial 11 — now look similar. And the rats that never received food continued to make more than 15 errors in each trial on average.

Try It
Glossary
Candela Citations
- Authored by: Patrick Carroll for Lumen Learning. Provided by: Lumen Learning. License: CC BY: Attribution
- Latent Learning: Learning Before Doing. Provided by: Open Learning Initiative. Located at: https://oli.cmu.edu/jcourse/workbook/activity/page?context=df3e71c60a0001dc051db622d622b3f7. Project: Psychology. License: CC BY-NC-SA: Attribution-NonCommercial-ShareAlike
- Operant Conditioning and Observational Learning. Authored by: OpenStax College. Located at: http://cnx.org/contents/Sr8Ev5Og@5.52:r470BCFb@7/Operant-Conditioning. License: CC BY: Attribution. License Terms: Download for free at http://cnx.org/contents/4abf04bf-93a0-45c3-9cbc-2cefd46e68cc@5.48
- Latent Learning. Authored by: Boundless. Located at: https://www.boundless.com/psychology/textbooks/boundless-psychology-textbook/learning-7/cognitive-approaches-to-learning-48/latent-learning-202-12737/. License: CC BY-SA: Attribution-ShareAlike
- Traquair House Maze. Authored by: marsroverdriver. Located at: https://en.wikipedia.org/wiki/File:Traquair_House_Maze.jpg. License: CC BY: Attribution
