Learning Outcomes
At the end of this chapter you will be able to do the following.
Apply Structural functionalism to the management of family resources.
Define terminology related to poverty
Surmise the outcomes of not having health insurance.
Create a budget.
A STRUCTURAL FUNCTIONALIST LOOK AT FAMILY RESOURCES
Since earliest human record, the family has been a group of persons committed to meeting one another’s economic needs. This is a vital function of the modern family. As newborns enter the family, they are fed and clothed, and are protected and nurtured into childhood, adolescence, and adulthood. When they leave home they continue to receive economic support, typically even into the college experience. Many adults receive financial help from family even after they graduate college, marry, and enter the workplace.
Functionalists would say that the family serves many functions for a society. Among them are replacing members of society by giving birth to and socializing children, regulating sexual activity, supporting family members economically, providing a place for society’s members to feel loved and secure, and providing a sense of social status in society.1
In one study of 1,727 parents of college students it was reported that “college students’ finances were of extreme or great concern to nearly half the parents.” Other findings reported by parents indicated that cell phones were the preferred method of communication.2
Parents not only continue to provide economic support, they also provide social and emotional support to their college-aged children. Many have noted that among college students today, “adulthood” may not be the best word to describe them. They continue to be dependent upon their parents at some level into their late 20’s. Perhaps “young adulthood” or in some cases “extended adolescence” is more accurately descriptive. In the U.S. colleges and universities are the gateways to financial security and opportunity; the higher the education the higher the income.
In 2008 over half the U.S. population had some college experience with 38 percent graduating at some level.3 In 2007 income levels by education showed a clear pattern of more money earned by those who have more education.4 About 45% of the U.S. population does not attend a college or university and some drop out of high school. This is a dual-edged issue. On one side poor people get lower quality K-12 education than middle and upper class people; thus, they have financial hardships that prevents their access to the gateway to financial security. However their lower financial and educational status undermines healthy and self-promoting lifestyles. Poorer people are more likely to be victimized by crime, commit crime, be hungry, cohabit and/or divorce, or be abused. Children raised in poorer families are of great concern.
POVERTY
Childhood today does not require children to contribute much back to the family economy for most families. In U.S. society, with all the privileges and economic affluence, there are still members of families, communities, and racial categories who go without, go hungry, and haven’t the slightest notion of ever going to college. A recent study pointed out the current trends in childhood rates of poverty.5 Using U.S. Census data this study indicated that in 2008, 19% of persons below the poverty level were children. New Hampshire was the lowest at 8.6% of children living below poverty while Arizona was the highest at 26.2% of their children living below the poverty line. In the U.S. children ages 0-17 comprised 73 million or 25% of the population, yet 41% live in poverty or near poverty.6 Children of color have a higher likelihood of living in poverty. Wight and Chau (2009) also reported that 27% of White children, 61% of Black children, 31% of Asian children, 57% of American Indian children, and 62% of Hispanic children live in poverty. Poverty in the U.S. is layered across racial categories, in other words, poverty is disproportionally racialized.
The U.S. has an official definition of being poor or being in poverty. The poverty line is the official measure of those whose incomes are less than three times a lower cost food budget. This definition has been the U.S.’s official poverty definition since the 1930s with only a few adjustments. Near poverty is when one earns up to 25% above the poverty line. In Table 1 you can see the U.S. Health and Human Services 2009 poverty guidelines with estimates of near poverty levels. Most who qualify as living below poverty also qualify for state and federal welfare which typically includes health care benefits, food assistance, housing and utility assistance, and some cash aid.
|
#of People |
Poverty |
Near Poverty- |
|
in Family |
Line |
125% of Poverty |
|
|
|
Line |
|
1 |
$10,830 |
$13,536 |
|
2 |
$14,570 |
$18,211 |
|
3 |
$18,310 |
$22,886 |
|
4 |
$22,050 |
$27,561 |
|
5 |
$25,790 |
$32,236 |
|
6 |
$29,530 |
$36,911 |
|
7 |
$33,270 |
$41,586 |
|
8 |
$37,010 |
$46,261 |
Table 1. U.S. Poverty Guidelines (2009) with Near Poverty Estimates.7
Those near poverty may or may not qualify depending upon current state and federal regulations. Absolute poverty is the level of poverty where individuals and families cannot sustain food, shelter, warmth, and safety needs.
U.S. Census data indicate that people have various levels of poverty by racial grouping. In Figure 1 you can see the poverty and near poverty rates for various racial groups in the Unites States from 1980 to 2006. The thick black line represents the sum of the percent in poverty and near poverty for each year. The ranges suggest about 25% or just below 1 in 4 being in or near poverty for the U.S. Whites (the red line, the lowest line) have the lowest rate of persons in poverty but make up the largest number of persons in poverty because Whites represent about 75% of the U.S. population. Asians are slightly higher than Whites.
The blue line which runs just about even with the Asian line represents the percent in poverty for all races combined. It’s much lower than the high rates of poverty for Blacks and Hispanics because Whites are such a large portion of the population, that it pulls the overall average downward for all races.
Figure 1. Poverty and Near Poverty (125 Percent of the Poverty Line) for U.S. by Race and Hispanic for 1980 to 2006.8

HEALTH CARE AND INSURANCE
Another measure of economic well-being is health care coverage (see Table 2). The U.S. Census Bureau reported that in 2007 about 15.3% or over 45 million in the U.S. had no health care coverage.9 Health care coverage is a major economic resource. Again White and Asian categories are in the higher strata on this resource. They have the lowest uninsured rates. Hispanics have the highest level of not being insured. Since nearly 60% of insurance is provided by employers, it makes sense that young adults (18-34 year olds) would be less likely to have insurance because they are still getting their formal educations and establishing their careers.
What about the nearly 11% of children overall without insurance or the nearly 18% of children in poverty without it? This is difficult to justify in today’s modern society. Every wealthy country to which the U.S. compares itself (Western Europe, Australia, Japan, etc.) offers health insurance as a right to all, not just a privilege to the wealthier people in the higher strata. The lower the income one has, the higher the risk of being uninsured. About 1 in 4 who work part-time or do not work at all have no insurance, while only 17% of full-time workers went without. The 2010 Federal Health Care Reform legislation established the first federal attempt to make health care coverage a right rather than a privilege. This monumental change will unfold over the next few years and time will tell how effective it is in equaling access to health care.
Table 2. U.S. Percent of Uninsured by Selected Characteristics 2007.10
|
Category |
% Uninsured |
|
Race |
|
|
White |
14.3% |
|
Black |
19.5% |
|
Asian |
16.8% |
|
Hispanic |
32.1% |
|
Age |
|
|
< 6 years old |
10.5% |
|
6-11 years old |
10.3% |
|
12-17 years old |
12.0% |
|
<18 years old |
19.0% |
|
18-24 years old |
28.1% |
|
25-34 years old |
25.7% |
|
35-44 years old |
18.3% |
|
45-64 years old |
14.0% |
|
65+ years old |
1.9% |
|
Income Level of Family |
|
|
<$25,000 per year income |
24.5% |
|
$25-49,999 per year income |
21.1% |
|
$50-74,999 per year income |
14.5% |
|
$75,000+ per year income |
7.8% |
|
Parent’s Work Status |
|
|
Worked Full-time |
17.0% |
|
Worked Part-time |
23.4% |
|
Did Not Work |
25.4% |
INCOME AND WEALTH
Figure 2 shows a comparison of income for single and dual-earner married households and also for single males and females. The data are presented in constant 2006 U.S. dollars which simply means they are adjusted for cost of living changes for each year. The first thing you see is that dual-earner marrieds (both husband and wife work in labor force) by far had the highest income levels every year from 1990 until 2006. Sole-earner married (husband only in labor force) comes in next followed closely by single males. Single females reported the lowest income.
Figure 2. A Comparison of U.S. Personal Income by Marital Status (includes dual versus sole breadwinner homes) in Constant 2006 U.S. Dollars.11
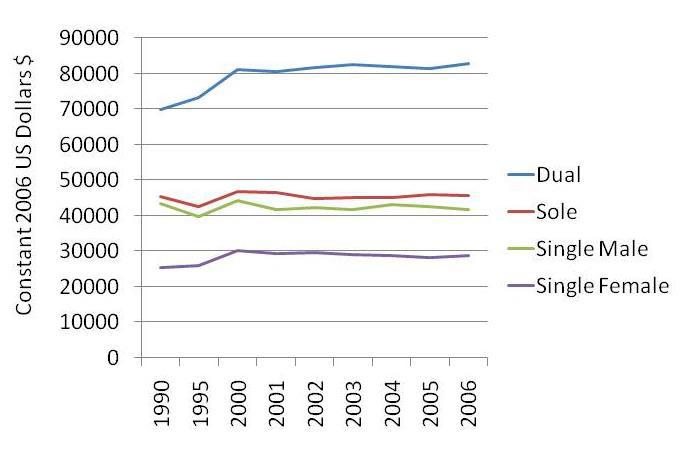
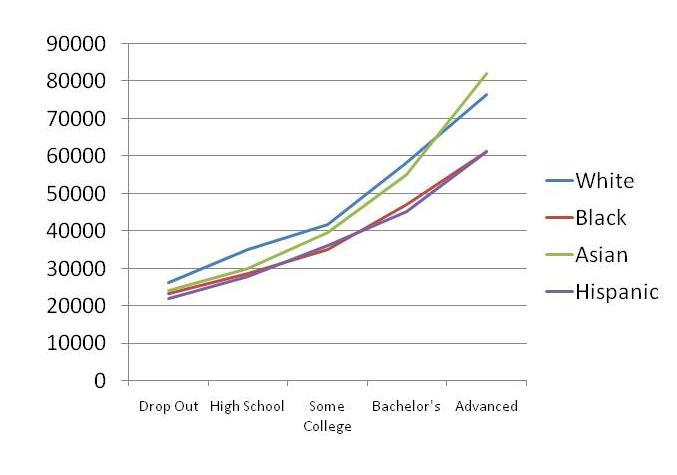
Figure 3 shows stratification in the U.S. by educational level. Keep in mind that the higher the education, the higher the annual income. This is typically true year after year. Income levels are higher for Whites and Asians followed by Blacks and Hispanics, but the layers are clearly visible by education level.
Not all economic disadvantage results from our choices. In the U.S. non-Whites, non-Asians, and non-males are more likely to be found in the lower layers. Figure 4 portrays what the layering of society might look like if the U.S. population were divided into three groups; the top 10% wealthy-elite, the next 20% upper-class, and the remaining 70% middle and lower classes. The top 10% owns the lion’s share of all the wealth available to be owned in the U.S. They own as much as 100 times the average U.S. person’s wealth. For a relative few, they make more in a year than most of us make in a lifetime. Theirs is the life of high levels of property, power, and prestige. The next 20% upper-class holds the high ranking jobs, they run for elected office, and they hold CEO-level positions in major corporations. These types of jobs pay more, require more education, require more abstract thought, and allow for more self-directed autonomy in their daily activities. The largest category includes the remainder of us. We fall into some layer of upper-middle class, middle class, working class, labor class, and poor.
Figure 3. A Comparison of the U.S. Personal Income of Full-Time Workers by Education Level 2007.12
HOME OWNERSHIP
For those who can in our current economic conditions, buying a home is the one major investment for most U.S. families. Even when interest rates are low, the cost of a home is extremely expensive. If you purchased a $100,000 home at eight percent interest for 30 years, your payment would be $733.76, and you would pay $100,000 for the home and another $164,154 in mortgage interest. That totals $264,154 for a $100,000 home. If the home does not appreciate in value, this is a terrible investment.
There are strategies that can be used to minimize the overall cost of purchasing a home. You can save money and put a large down payment on the home. This will lower the initial cost of the amount financed. You can make an extra 1/12th of a house payment toward the principle of the loan every month. By the end of the year, you would have made a 13th payment to lower the overall balance of the loan (principle). Another strategy is to have a 15 year loan instead of a 30 year loan. In the loan above, that would mean making a monthly payment of $955.65 instead of $733.76. How might that benefit you? First, you’d pay off the loan in 15 not 30 years and second, you’d save $91,626 in mortgage interest. One of the major U.S. financial problems has been the financing of established worth of the home into a second mortgage or home equity loan. Home equity is the value in the home that is higher than the amount still owed on the home loan. Debt can be detrimental to a family economy.
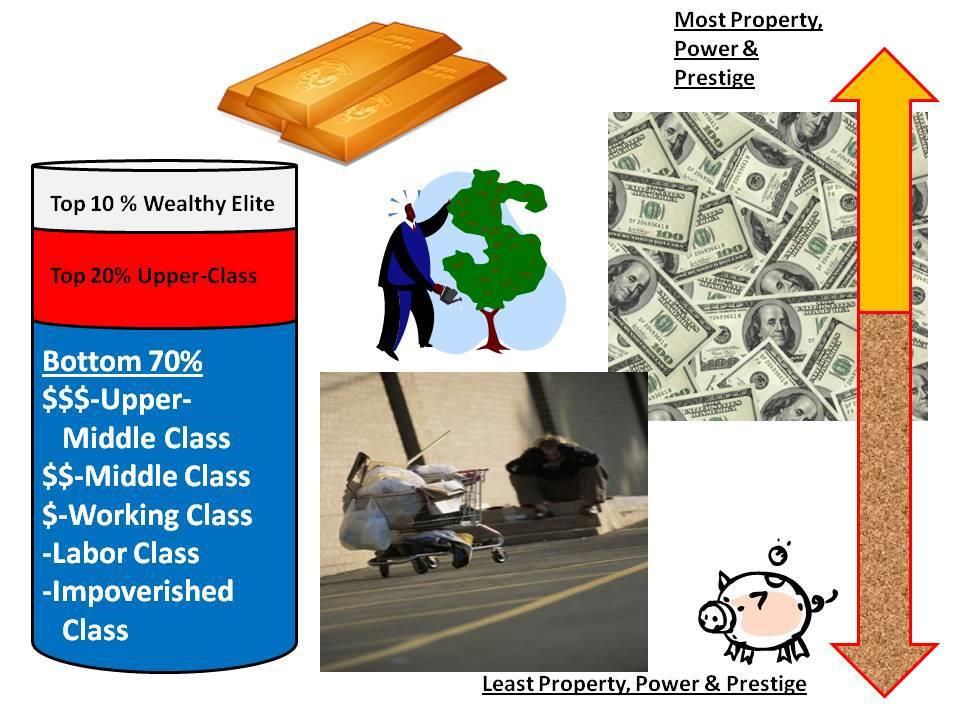
Figure 4. Portrayal of United States’ Economic Layering.12
The average credit card balance for a family with at least one credit card is $16,007. This is important because the U.S. has become a nation with liberal debt and debt incurring policies.13 Woolsey and Schulz also reported that there were over ½ billion credit cards in circulation in the U.S. contributing to a total consumer debt of $2.46 trillion. Eight percent of U.S. college students are reported to have credit with an average amount owed of $2,200. They are also estimated to have accrued $20,000 in student loan debt. To illustrate, think about tearing a $100 bill into small pieces. This would bother most people because the money is wasted and can’t be reused.
Why do we spend $100 on a purchase for something we don’t need and might never use and not even flinch, yet get bent out of shape over a $100 dollar bill being torn? The dollar bill is tangible and touchable. The credit card purchases are blips on electronic screens or numbers on paper receipts. It’s funny money to many of us. We are heavily marketed to go into debt. Think of all the credit card offers your family receives in the mail. The debt is there for the taking without one caution to the consumer. Very few of the companies that loan money ever warn consumers about the problems of getting into too much debt. Why would they if you can have what you want immediately and pay it back over the next 5-10 years with massive interest payments? Their ideal customer would run up a large balance of debt and make a minimum payment each month, thereby bringing in the most profits to the company, but the wise consumer uses debt to his or her advantage.
Credit cards are not necessarily a bad thing. They facilitate travel and small transactions for the family; however, credit card balances or unpaid debt can be very burdensome to a budget. The rules of three guides good credit use. The first rule is to save three months’ worth of income and keep it in the bank. That means save enough to meet all your fixed debts (rent, mortgage, car, medical, insurance, etc.) so that you can keep your family afloat if you suffer a job loss or crisis.
The second rule is to have only one credit card with no bonus or rewards program. Keep a zero balance on it. Set your credit limit to what it might cost to pay three weeks worth of bills (including your rent, mortgage, and car payments). If you have a lower limit on it you can more readily control your spending. Don’t ever use your credit card for long-term debt. It should be a tool for short-term financial matters.
The third rule is whenever there is a consumer item you really want (TV, Cell Phone, Handheld, etc.) wait three full days before you buy it. If it’s on sale and you think you will miss a good buy if you wait, remember that it will go on sale again. If you haven’t planned for it, saved for it, and budgeted for it, then a three day cooling off period may help you prevent unwanted and unneeded debt. Keep in mind that if we are marketed to with an approach of “hurry, sale ends soon,” then most likely the marketing has triggered the use of our emotional decision-making processes (limbic part of brain) and we might rush out and buy feeling like we are actually being responsible purchasing agents; even if we never really needed or wanted what the sale is selling.
Most couples don’t have a monthly budget. It makes it very difficult to manage a family’s finances without one. There are numerous free budgets online and if you are familiar with Microsoft Excel, it works very nicely for a budget. The two main things about a monthly budget are to be able to know how much money you currently have and where you are spending it.
BUDGETING
To develop a budget, make a list of all your fixed expenses which are monthly expenses that are set and do not depend upon your consumer choices. These typically include rent, mortgage payments, car payments, and insurance payments to name a few. Now make a list of other things you spend your money on that relate to household matters. These fall under the definition of variable expenses which are expenses that can change from month-to-month based on needs and wants and which are not fixed expenses. These typically include food, gasoline and car maintenance, pay-per-view, groceries, clothing, etc.
Step 1 in budgeting is to record your income. Step 2 is to record everything you spend for an entire month. Table 3 has hypothetical numbers placed in it to demonstrate how the budget works. It budgets $1,091 dollars per month. This would be the amount you spent in the first month in each of your own categories. In the second month, you deduct what you spent from each of these categories.
Notice that three of these budget categories broke even. They are also the three fixed expenses. Notice also that three others had left-over monies. The “Fun” category was overspent by $40.00, which could be filled with leftovers from the other categories. When a category is overspent you should decide if it requires more allocation (for example increase Fun to $90.00 per month) or control spending to keep it under the limit. This hypothetical month had $128.00 left over and it could be saved or rolled into the next month in case unexpected expenses show up.
Fundamentally, a budget tracks where you spend your money, how much you currently have, and how to strategize savings for future plans. Wise college students learn to budget sooner rather than later so that as their family size increases, so does their skills in budgeting.
The hedonistic treadmill emerged as a concept in recent self-help books of financial matters. Hedonism is the pursuit of pleasure as the main goal of one’s life with pleasure being the core value of daily life. Many in the U.S. have fallen into the trap of seeing pleasure as the best goal and a purchase as the best way to acquire that pleasure. Thus, they get on a treadmill of purchasing which cannot provide long-lasting pleasure in most cases, and requires new and more varied purchases to renew that short-term pleasure over and over. The hedonistic treadmill would not be a major problem if one were very wealthy; but, for average middle class person, the marketing pressures to buy, the patterns of seeing a purchase as a path to happiness, and the availability of easy to obtain credit make it very difficult to get off the treadmill. This pattern can be very destructive financially and can undermine the family system as a whole. Figure 5 shows a list of financial best practices that can be very useful to follow for stability and security in the family.
It surprises some people to hear that debt can be a good thing. It can be if debt is used wisely. Credit cards are a necessity for most and can be useful in building a strong credit score. To control credit card use is simple. Spend with it very conservatively, pay your balance off every month, never spend up to your limit, and make sure others can’t use your card. How well you use and manage your credit card now will influence how well you qualify for car and home loans later in your life.
Table 3. Your First Month’s Budget.
Month ________________ All Incoming Monies $___________
|
Rent/Mortgage |
CarPayment/BusPass |
InsurancePayments |
Cell Phone |
Food |
Utilities |
Fun |
Savings |
|
|
|
|
|
|
|
|
|
|
$250.00 |
$125.00 |
$76.00 |
$75.00 |
$275.00 |
$190.00 |
$50.00 |
$50.00 |
|
-$250 |
-$125.00 |
-$76.00 |
-$49.50 |
-$10.00 |
-$142.00 |
-$15.00 |
|
|
|
|
|
|
-$25.00 |
|
-$25.00 |
|
|
|
|
|
|
-$17.00 |
|
-$17.00 |
|
|
|
|
|
|
-$38.00 |
|
-$18.00 |
|
|
|
|
|
|
-$14.00 |
|
-$10.00 |
|
|
|
|
|
|
-$12.00 |
|
-$ 5.00 |
|
|
|
|
|
|
-$45.00 |
|
|
|
|
|
|
|
|
-$15.00 |
|
|
|
|
|
|
|
|
-$20.00 |
|
|
|
|
|
|
|
|
-$ 9.00 |
|
|
|
|
|
|
|
|
-$25.00 |
|
|
|
|
Monthly |
Monthly |
Monthly |
Monthly |
Monthly |
Monthly |
Monthly |
|
|
spending |
spending |
spending |
spending |
spending |
spending |
spending |
|
|
= – |
= – |
= – |
= – |
= – |
= – |
= – |
|
|
$250.00 |
$125.00 |
$76.00 |
$49.50 |
$230.00 |
$142.00 |
$90.00 |
|
|
Leftover |
Leftover |
Leftover |
Leftover |
Leftover |
Leftover |
Leftover |
Leftover |
|
= $.00 |
= $.00 |
= $.00 |
= $25.50 |
= $45.00 |
= $48.00 |
= – |
= $50.00 |
|
|
|
|
|
|
|
$40.00 |
|
Mortgages are an example of good debt provided your loan is not beyond your means. Homeowners have economic advantages that renters do not have. Mortgage interest can be deducted from taxes. Having a mortgage and paying your monthly payments on time is an effective way to build your credit score.
Guarding your credit score is crucial for your family’s financial security. In the 1950’s two researchers began a scoring system designed to provide a standardized credit score for everyone in the U.S. The FICO Score is the most common credit scoring system in the world and is named after Bill Fair and Earl Isaac—Fair Isaac Corporation score or FICO. Your credit score is comprised of your payment history, how your credit capacity compares to your usage (not too many unpaid balances), how long you’ve had credit, which types of credit you’ve had, and finally how many times your credit was checked.14 There are many studies that demonstrate that misusing credit negatively impacts college students’ overall lives and experiences.15
Figure 5. Strategies and Rules for Sound Family Financial Practices

THE FINANCIAL PLAN
Every family needs a 5, 10, 15, and 20 year financial plan. For the most part such a plan focusses on long-term goals while giving you guidelines to follow in the short-term. Answer these simple questions: “What do we need/want to pay for in 5, 10, 15, and 20 years and how do we need to prepare now to accomplish those dreams?” Owning a home, planning for retirement, putting kids through college, life insurance coverage, starting a business, traveling the world, being debt free, and other goals might emerge in the planning process. Once you have these goals typed out for the next two decades you can fit most of your budgeting, saving, and spending activities into them. Remember that the “Rules of Three” suggest not buying in a hurry, and that makes even more sense when you think about the nature of each purchase as it fits into the long-term plan.
Most people don’t save. In fact many spend more than they earn and have a balance on their credit cards each month but saving for three months may make the difference between staying afloat and going under if you lose a job, get sick, or have an unexpected crisis that cost too much money for a regular monthly income. Start small with $5-10 per week. Put the money in a savings account that is hard to get to. In other words, consider putting your savings in a credit union or bank separate from the one where you keep your checking account so that you have to go out of the way to get to your savings. If you save $10 per week for a year you have $520.00 saved in just one year. In five years you would have saved $2,600.00. No matter what, don’t take out your savings unless it is truely an emergency. Keep it there, let it build up and take it out when nothing else can be done to pay an expense. Use your monthly budget to estimate how much a three-month savings would need to be.
If you are middle class, you can increase your family’s net worth by following a few basic principles. First invest low and sell high. Second, consider real estate investments. Third, become a full-on, unabashed cheapskate. Don’t ever pay full price for anything. Don’t ever sell below the market value. Fourth, don’t ever try to do the expert stuff by yourself. It is very easy to get an advisor, read a book, attend a seminar, or get professionals on your team.
Some of us sabotage our own efforts at saving, why?
Entitlement is a feeling of wanting something for nothing, of being justified in having one’s wants met, and or a feeling of being excluded from the same rules that bind most of the members of society. You may benefit from knowing that the concept of “sense of entitlement” is often associated with addictive behaviors and unhealthy relationship patterns. Entitled people have difficulty discerning the difference between “what I want” and “what I need” when it comes to money. A flat screen TV is owed to them if they want it because they are special and their needs should be met regardless of the finances involved to acquire them. Entitled people feel that it is their right to have what they want. Many of us have feelings of entitlement in some areas of our lives. But when, or if, our pursuit of the things we want interferes with our financial security, moral and ethical propriety, or social responsibilities, this entitlement can become pathological.
In the U.S. especially many people feel entitled when it comes to consumer goods. They feel obligated to buy things that truly fall under the category of wants rather than needs. Many, who lack enough resources will overspend in the process of acquiring things they sometimes feel buyer’s remorse over. It is a painful lesson to learn when debt suddenly becomes overbearing. A good policy is to never finance a pizza. Pizzas, movie rentals, new clothes, and other small ticket items add up way too fast and it is unwise to make many small purchases that land you with a pile of debt. Not having family financial guidelines leaves one with no guidance, little direction, and a vulnerability to financial insecurity in the very aggressive market-place-based society that ours has come to be.
When we mispend or manage our finances poorly or in destructive ways we often have legitimate needs but are trying to meet them in the wrong way. Some people shop when they feel lonely. They might also spend money for cruises or fun, but soon find that being with other people is not always the cure for loneliness and that happiness is a choice only they can make for themselves. Others spend to make up to themselves (or their own children) for neglectful, abusive, and traumatic childhood circumstances. Money in this case is used both to medicate the problem (with a cure that doesn’t work) and to reinforce their shameful feelings of worthlessness. So if they mispend and mismanage their money, they simultaneously create problems that prove what they’ve felt all along—they are not worthy of happiness or success.
There are those who put a tremendous amount of energy into looking good, appearing to be wealthy or privileged, or being more sophisticated than they truly are. Some people have a millionaire’s taste and a janitor’s income. The medicating phenomenon in money mismanagement is similar in many ways to the medicating phenomenon in drug and alcohol abuse. People who hurt try to distract themselves from it by getting a short-term high from their money or spending. They go to Vegas, buy something new, take friends and family out for dinner, and engage in other costly activities that keep them from feeling whatever pain that hurts them.
THE ELDERLY
Today’s elderly have a reputation for being conservative in their spending and in saving. Yet more and more elderly are mismanaging their money. USA Today online reported that “From 1991 to 2007, the rate of personal bankruptcy filings among those ages 65 or older jumped by 150%, according to AARP, which will release the new research from the Consumer Bankruptcy Project. The most startling rise occurred among those ages 75 to 84, whose rate soared 433%.”16
Reasons for this trend include medical bills, wanting things they can’t afford, maintaining a higher status, being taken advantage of by predatory lenders, and inflation that makes the spending power of their retirements less powerful. Predators tend to take advantage of the elderly, but others fall prey to them also.
The most common theme is the quick cash, something-for-nothing, rare opportunity approach that makes you feel pressure to act now or you might miss the payoff. By far the most notable U.S. con man was Bernie Madoff who conned millions from the country’s elite class who invested with him in order to get a huge and quick payoff on their money.
Confidence scams tend to exploit our greed, vanity, and ignorance as they promise quick profits, low risks, and certain outcomes. Confidence scams are as old as time and rarely ever produce the desired outcome for the investor. They are fundamentally unsecured loans with huge risks and will cost millions of dollars this year to naïve investors. There never has and never will be a something for nothing miracle investment.
THE HOUSEHOLD
There is often a debate between spouses and partners about what is a need and what is a want. A need is something important to our health and well-being. A want is something we’d like to have. The trick of being united in your budget and spending choices is to work together, communicate about needs and wants, and to yield to one another’s wants at times. Unfortunately there is no universal standard of a true need versus a true want. It depends on each individual family member.
What about household and workplace tasks? When one considers the day-to-day lives of women in today’s marketplace, and perhaps more importantly in their personal lives, the concept of what women do as their contribution to the functioning of families and of society becomes important. Instrumental tasks are the goal-directed activities which link the family to the surrounding society, geared toward obtaining resources. This includes economic work, breadwinning, and other resource-based efforts. Expressive tasks pertain to the creation and maintenance of a set of positive, supportive, emotional relationships within the family unit. This includes relationships, nurturing, and social connections needed in the family and society. Today, women typically do both types of tasks while men still focus more on instrumental tasks.
Prior to the Industrial Revolution both males and females combined their economic efforts in homemaking. Most of these efforts were cottage industry-type where families used their family’s labor to make products they needed such as soap, thread, fabric, and butter. When the factory model of production emerged in Western Civilization, the breadwinner and homemaker roles became more distinct from each other. A breadwinner is a person who earns wages outside of the home and uses them to support the family. A homemaker is a person, typically a woman, who occupies her life with mothering, housekeeping, and being a wife while depending heavily on the breadwinner. Since World War II more and more women have become breadwinners or co-breadwinners. Not as many men have made the move into the homemaking role.
If we look at the changes in family functions (functionalism) overtime, we see that in prior to the Industrial Revolution there were many more functions of a family. All education, including religious, took place within the family when they lived too far from a town and the family was the center of economic activity (producing goods needed for the family). Today we send our children to school and religious education classes and we buy our clothes, soap, and food at a store.
- Child Poverty Rates Increased as Recession Began. Retrieved 30 November 2009 from http://www.ncsl.org/default.aspx?tabid=18557
- Basic Facts about Low-income Children, by Wight, V.R. and Chau, M. Nov 2009; retrieved 31 March, 2010 from http://www.nccp.org/publications/pub_892.html
- Retrieved 22 April 2009 The 2009 HHS Poverty Guidelines from http://aspe.hhs.gov/POVERTY/09poverty.shtml
- Asian data not available until 1990Retrieved 22 April, 2009 from Table 693. Families Below poverty Level and Below 125 Percent of Poverty Level by Race and Hispanic Origin: 1980 to 2006 from http://www.census.gov/compendia/statab/tables/09s0693.pdf
- retrieved 22 April, 2009 from http://www.census.gov/prod/2008pubs/p60-235.pdf
- Retrieved 22 April, 2009 from Table 6. People Without Health Insurance Coverage by Selected Characteristics: 2006 and 2007& Figure 8. Uninsured Children by Poverty Status, Age, and Race and Hispanic Origin: 2007 from http://www.census.gov/prod/2008pubs/p60-235.pdf
- Retrieved 21 April 2009 from www.census.gov Table 677. Median Income of Families by Type of Family in Current and Constant (2006) Dollars: 1990 to 2006
- Retrieved 21 April 2009 from “Educational Attainment in the United States: 2007” from
- http://www.census.gov/prod/2009pubs/p20-560.pdf
- © 2009 Ron J. Hammond, Ph.D.
- retrieved 1 April, 2010 from http://www.creditcards.com/credit-card-news/credit-card-industry-facts-personal-debt-statistics-1276.php#footnote1 Credit card statistics, industry facts, debt statistics By Ben Woolsey and Matt Schulz
- retrieved 2 April, 2010 from http://en.wikipedia.org/wiki/Credit_score_(United_States)#FICO_score_and_others
- see for example, Xiao, J. S. (2007). Academic Success and Well-Being of College Students: Behaviors Matter. Take Charge of America Institute Report, November , 1-23
- Bankruptcy Rising Among Seniors” retrieved 5 April, 2010 from http://www.usatoday.com/money/perfi/retirement/2008-06-16-bankruptcy-seniors_N.htm