Learning Objectives
- Calculate equilibrium concentrations from the values of the initial amounts and the Keq.
There are some circumstances in which, given some initial amounts and the Keq, you will have to determine the concentrations of all species when equilibrium is achieved. Such calculations are not difficult to do, especially if a consistent approach is applied. We will consider such an approach here.
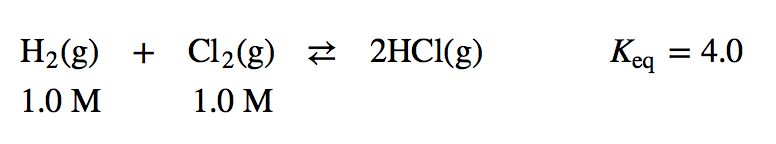
Suppose we have this simple equilibrium. Its associated Keq is 4.0, and the initial concentration of each reactant is 1.0 M:
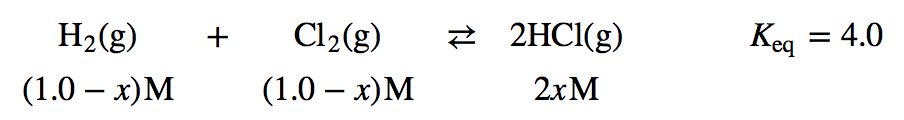
Because we have concentrations for the reactants but not the products, we presume that the reaction will proceed in the forward direction to make products. But by how much will it proceed? We don’t know, so let us assign it a variable. Let us assume that x M H2 reacts as the reaction goes to equilibrium. This means that at equilibrium, we have (1.0 − x) M H2 left over.
According to the balanced chemical equation, H2 and Cl2 react in a 1:1 ratio. How do we know that? The coefficients of these two species in the balanced chemical equation are 1 (unwritten, of course). This means that if x M H2 reacts, x M Cl2 reacts as well. If we start with 1.0 M Cl2 at the beginning and we react x M, we have (1.0 − x) M Cl2 left at equilibrium.
How much HCl is made? We start with zero, but we also see that 2 mol of HCl are made for every mole of H2 (or Cl2) that reacts (from the coefficients in the balanced chemical equation), so if we lose x M H2, we gain 2x M HCl. So now we know the equilibrium concentrations of our species:
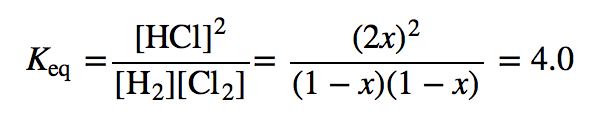
We can substitute these concentrations into the Keq expression for this reaction and combine it with the known value of Keq:
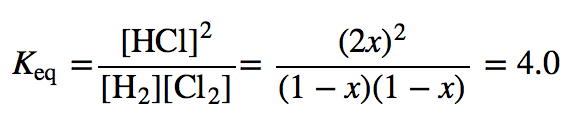
This is an equation in one variable, so we should be able to solve for the unknown value. This expression may look formidable, but first we can simplify the denominator and write it as a perfect square as well:

The fraction is a perfect square, as is the 4.0 on the right. So we can take the square root of both sides:

Now we rearrange and solve (be sure you can follow each step):
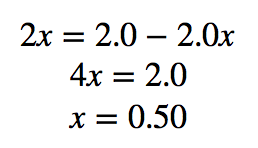
Now we have to remind ourselves what x is—the amount of H2 and Cl2 that reacted—and 2x is the equilibrium [HCl]. To determine the equilibrium concentrations, we need to go back and evaluate the expressions 1 − x and 2x to get the equilibrium concentrations of our species:
1.0 − x = 1.0 − 0.50 = 0.50 M = [H2] = [Cl2]
2x = 2(0.50) = 1.0 M = [HCl]
The units are assumed to be molarity. To check, we simply substitute these concentrations and verify that we get the numerical value of the Keq, in this case 4.0:

We formalize this process by introducing the ICE chart, where ICE stands for initial, change, and equilibrium. The initial values go in the first row of the chart. The change values, usually algebraic expressions because we do not yet know their exact numerical values, go in the next row. However, the change values must be in the proper stoichiometric ratio as indicated by the balanced chemical equation. Finally, the equilibrium expressions in the last row are a combination of the initial value and the change value for each species. The expressions in the equilibrium row are substituted into the Keq expression, which yields an algebraic equation that we try to solve.
The ICE chart for the above example would look like this:
| H2(g) | + | Cl2(g) | ⇄ | 2HCl(g) | Keq = 4.0 | |
|---|---|---|---|---|---|---|
| I | 1.0 | 1.0 | 0 | |||
| C | −x | −x | +2x | |||
| E | 1.0 − x | 1.0 − x | +2x |
Substituting the last row into the expression for the Keq yields
which, of course, is the same expression we have already solved and yields the same answers for the equilibrium concentrations. The ICE chart is a more formalized way to do these types of problems. The + sign is included explicitly in the change row of the ICE chart to avoid any confusion.
Sometimes when an ICE chart is set up and the Keq expression is constructed, a more complex algebraic equation will result. One of the more common equations has an x2 term in it and is called a quadratic equation. There will be two values possible for the unknown x, and for a quadratic equation with the general formula ax2 + bx + c = 0 (where a, b, and c are the coefficients of the quadratic equation), the two possible values are as follows:
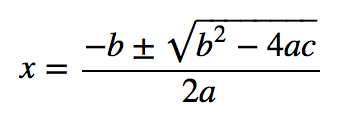
One value of x is the + sign used in the numerator, and the other value of x is the − sign used in the numerator. In this case, one value of x typically makes no sense as an answer and can be discarded as physically impossible, leaving only one possible value and the resulting set of concentrations. Example 9 illustrates this.
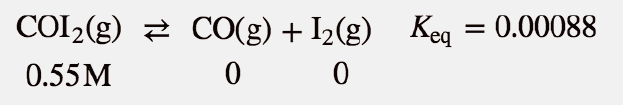
Example 9
Set up an ICE chart and solve for the equilibrium concentrations in this chemical reaction.
Solution
The ICE chart is set up like this. First, the initial values:
| COI2(g) | ⇄ | CO(g) | + | I2(g) | |
|---|---|---|---|---|---|
| I | 0.55 | 0 | 0 | ||
| C | |||||
| E |
Some of the COI2 will be lost, but how much? We don’t know, so we represent it by the variable x. So x M COI2 will be lost, and for each COI2 that is lost, x M CO and x M I2 will be produced. These expressions go into the change row:
| COI2(g) | ⇄ | CO(g) | + | I2(g) | |
|---|---|---|---|---|---|
| I | 0.55 | 0 | 0 | ||
| C | −x | +x | +x | ||
| E |
At equilibrium, the resulting concentrations will be a combination of the initial amount and the changes:
| COI2(g) | ⇄ | CO(g) | + | I2(g) | |
|---|---|---|---|---|---|
| I | 0.55 | 0 | 0 | ||
| C | −x | +x | +x | ||
| E | 0.55 − x | +x | +x |
The expressions in the equilibrium row go into the Keq expression:
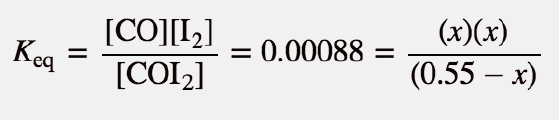
We rearrange this into a quadratic equation that equals 0:
0.000484 − 0.00088x = x2
x2 + 0.00088x − 0.000484 = 0
Now we use the quadratic equation to solve for the two possible values of x:
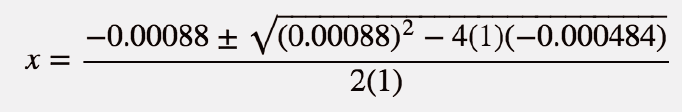
Evaluate for both signs in the numerator—first the + sign and then the − sign:
x = 0.0216 or x = −0.0224
Because x is the final concentration of both CO and I2, it cannot be negative, so we discount the second numerical answer as impossible. Thus x = 0.0216.
Going back to determine the final concentrations using the expressions in the E row of our ICE chart, we have
[COI2] = 0.55 − x = 0.55 − 0.0216 = 0.53 M
[CO] = x = 0.0216 M
[I2] = x = 0.0216 M
You can verify that these numbers are correct by substituting them into the Keq expression and evaluating and comparing to the known Keq value.
Test Yourself
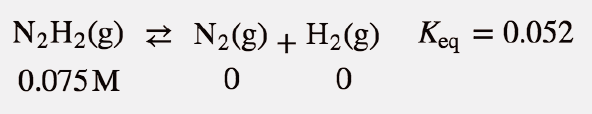
Set up an ICE chart and solve for the equilibrium concentrations in this chemical reaction.
Answer
The completed ICE chart is as follows:
| N2H2(g) | ⇄ | N2(g) | + | H2(g) | |
|---|---|---|---|---|---|
| I | 0.075 | 0 | 0 | ||
| C | −x | +x | +x | ||
| E | 0.075 − x | +x | +x |
Solving for x gives the equilibrium concentrations as [N2H2] = 0.033 M; [N2] = 0.042 M; and [H2] = 0.042 M
Key Takeaways
- An ICE chart is a convenient way to determine equilibrium concentrations from starting amounts.
Exercises
-
Describe the three parts of an ICE chart.
-
What is the relationship between the equilibrium row in an ICE chart and the other two rows?
-
Set up (but do not solve) an ICE chart for this reaction, given the initial conditions.

-
Set up (but do not solve) an ICE chart for this reaction, given the initial conditions.

-
Given that pure solids and liquids do not appear in Keq expressions, set up the ICE chart for this reaction, given the initial conditions.

-
Given that pure solids and liquids do not appear in Keq expressions, set up the ICE chart for this reaction, given the initial conditions.
-
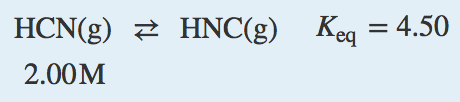
Determine the equilibrium concentrations for this chemical reaction with the given Keq.

-
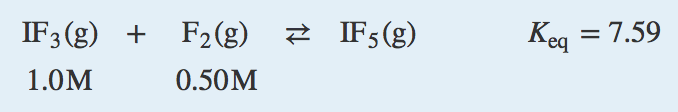
Determine the equilibrium concentrations for this chemical reaction with the given Keq.

-
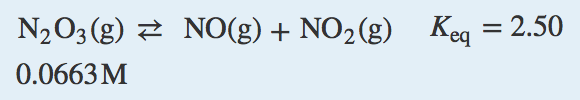
Determine the equilibrium concentrations for this chemical reaction with the given Keq.

-
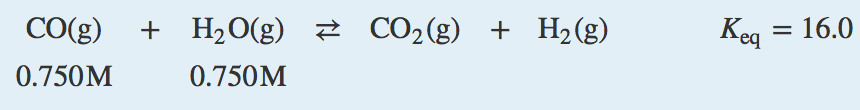
Determine the equilibrium concentrations for this chemical reaction with the given Keq.

-
Determine the equilibrium concentrations for this chemical reaction with the given Keq.

-
Determine the equilibrium concentrations for this chemical reaction with the given Keq.

Answers
1.
I = initial concentrations; C = change in concentrations; E = equilibrium concentrations
3.
| 3O2 | ⇄ | 2O3 | |
|---|---|---|---|
| I | 0.075 | 0 | |
| C | −3x | +2x | |
| E | 0.075 − 3x | +2x |
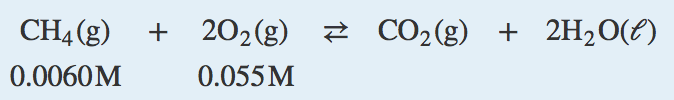
5.
| CH4 | + | 2O2 | ⇄ | CO2 | + | 2H2O | |
|---|---|---|---|---|---|---|---|
| I | 0.0060 | 0.055 | 0 | 0 | |||
| C | −x | −2x | +x | — | |||
| E | 0.0060 − x | 0.055 − 2x | +x | — |
7.
[HCN] = 0.364 M; [HNC] = 1.64 M
9.
[N2O3] = 0.0017 M; [NO] = [NO2] = 0.0646 M
11.
[H2S] = 0.836 M; [H2] = 0.046 M
Candela Citations
- Introductory Chemistry- 1st Canadian Edition . Authored by: Jessie A. Key and David W. Ball. Provided by: BCCampus. Located at: https://opentextbc.ca/introductorychemistry/. License: CC BY-NC-SA: Attribution-NonCommercial-ShareAlike. License Terms: Download this book for free at http://open.bccampus.ca