Learning Objectives
By the end of this section, you will be able to:
- Apply the production possibility frontier to evaluate the tradeoff between economic output and the environment
- Interpret a graphic representation of the tradeoff between economic output and environmental protection
We can analyze the tradeoff between economic output and the environment with a production possibility frontier (PPF) such as the one in [link]. At one extreme, at a choice like P, a country would be selecting a high level of economic output but very little environmental protection. At the other extreme, at a choice like T, a country would be selecting a high level of environmental protection but little economic output. According to the graph, an increase in environmental protection involves an opportunity cost of less economic output. No matter what their preferences, all societies should wish to avoid choices like M, which are productively inefficient. Efficiency requires that the choice should be on the production possibility frontier.
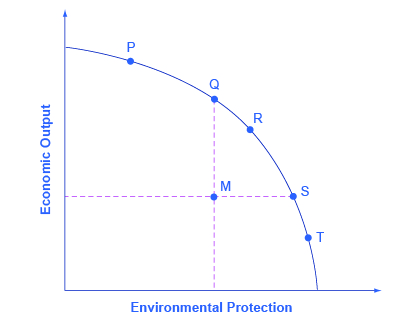
The Tradeoff between Economic Output and Environmental Protection Each society will have to weigh its own values and decide whether it prefers a choice like P with more economic output and less environmental protection, or a choice like T with more environmental protection and less economic output.
Economists do not have a great deal to say about the choice between P, Q, R, S and T in [link], all of which lie along the production possibility frontier. Countries with low per capita gross domestic product (GDP), such as China, place a greater emphasis on economic output—which in turn helps to produce nutrition, shelter, health, education, and desirable consumer goods. Countries with higher income levels, where a greater share of people have access to the basic necessities of life, may be willing to place a relatively greater emphasis on environmental protection.
However, economists are united in their belief that an inefficient choice such as M is undesirable. Rather than choosing M, a nation could achieve either greater economic output with the same environmental protection, as at point Q, or greater environmental protection with the same level of output, as at point S. The problem with command-and-control environmental laws is that they sometimes involve a choice like M. Market-oriented environmental tools offer a mechanism for providing either the same environmental protection at lower cost, or providing a greater degree of environmental protection for the same cost.
Bring it Home
Keystone XL
How would an economist respond to claims of environmental damage caused by the Keystone XL project? Clearly, we can consider the environmental cost of oil spills a negative externality, but how large would these external costs be? Furthermore, are these costs “too high” when we measure them against any potential for economic benefit?
As this chapter indicates, in deciding whether pipeline construction is a good idea, an economist would want to know not only about the marginal benefits resulting from the additional pipeline construction, but also the potential marginal costs—and especially the pipeline’s marginal external costs. Typically these come in the form of environmental impact statements, which are usually required for such projects. The most recent impact statement, released in March 2013 by the Nebraska Department of State, considered the possibility of fewer pipeline miles going over the aquifer system and avoiding completely environmentally fragile areas. It indicated that pipeline construction would not harm “most resources”.
The Obama Administration declined to approve construction of the Keystone XL project. However, the Trump administration has already announced its willingness to do so. While we may fairly easily quantify the economic benefits of additional oil in the United States, the social costs are more challenging to measure. It seems that, in a period of less than robust economic growth, people are giving the benefit of the doubt that the marginal costs of additional oil generation will be less than the marginal benefits.
Key Concepts and Summary
Depending on their different income levels and political preferences, countries are likely to make different choices about allocative efficiency—that is, the choice between economic output and environmental protection along the production possibility frontier. However, all countries should prefer to make a choice that shows productive efficiency—that is, the choice is somewhere on the production possibility frontier rather than inside it. Revisit Choice in a World of Scarcity for more on these terms.
Self-Check Questions
A country called Sherwood is very heavily covered with a forest of 50,000 trees. There are proposals to clear some of Sherwood’s forest and grow corn, but obtaining this additional economic output will have an environmental cost from reducing the number of trees. [link] shows possible combinations of economic output and environmental protection.
| Combos | Corn Bushels (thousands) | Number of Trees (thousands) |
|---|---|---|
| P | 9 | 5 |
| Q | 2 | 30 |
| R | 7 | 20 |
| S | 2 | 40 |
| T | 6 | 10 |
- Sketch a graph of a production possibility frontier with environmental quality on the horizontal axis, measured by the number of trees, and the quantity of economic output, measured in corn, on the vertical axis.
- Which choices display productive efficiency? How can you tell?
- Which choices show allocative efficiency? How can you tell?
- In the choice between T and R, decide which one is better. Why?
- In the choice between T and S, can you say which one is better, and why?
- If you had to guess, which choice would you think is more likely to represent a command-and-control environmental policy and which choice is more likely to represent a market-oriented environmental policy, choice Q or S? Why?

Review Questions
In the tradeoff between economic output and environmental protection, what do the combinations on the protection possibility curve represent?
What does a point inside the production possibility frontier represent?
Critical Thinking Questions
Technological innovations shift the production possibility curve. Look at graph you sketched for [link] Which types of technologies should a country promote? Should “clean” technologies be promoted over other technologies? Why or why not?
Problems
In the Land of Purity, there is only one form of pollution, called “gunk.” [link] shows possible combinations of economic output and reduction of gunk, depending on what kinds of environmental regulations you choose.
| Combos | Eco Output | Gunk Cleaned Up |
|---|---|---|
| J | 800 | 10% |
| K | 500 | 30% |
| L | 600 | 40% |
| M | 400 | 40% |
| N | 100 | 90% |
- Sketch a graph of a production possibility frontier with environmental quality on the horizontal axis, measured by the percentage reduction of gunk, and with the quantity of economic output on the vertical axis.
- Which choices display productive efficiency? How can you tell?
- Which choices show allocative efficiency? How can you tell?
- In the choice between K and L, can you say which one is better and why?
- In the choice between K and N, can you say which one is better, and why?
- If you had to guess, which choice would you think is more likely to represent a command-and-control environmental policy and which choice is more likely to represent a market-oriented environmental policy, choice L or M? Why?
Candela Citations
- Principles of Microeconomics, 2nd Edition. Authored by: OpenStax. Provided by: Rice University. Located at: http://cnx.org/contents/5c09762c-b540-47d3-9541-dda1f44f16e5@8.1.. License: CC BY: Attribution. License Terms: Download for free at http://cnx.org/contents/5c09762c-b540-47d3-9541-dda1f44f16e5@8.1.